Square Enix 2008 Annual Report Download - page 44
Download and view the complete annual report
Please find page 44 of the 2008 Square Enix annual report below. You can navigate through the pages in the report by either clicking on the pages listed below, or by using the keyword search tool below to find specific information within the annual report.-
 1
1 -
2
-
3
-
4
-
5
-
6
-
7
-
8
-
9
-
10
-
11
-
12
-
13
-
14
-
15
-
16
-
17
-
18
-
19
-
20
-
21
-
22
-
23
-
24
-
25
-
26
-
27
-
28
-
29
-
30
-
31
-
32
-
33
-
 34
34 -
 35
35 -
 36
36 -
 37
37 -
 38
38 -
 39
39 -
 40
40 -
 41
41 -
 42
42 -
 43
43 -
 44
44 -
 45
45 -
 46
46 -
 47
47 -
 48
48 -
 49
49 -
 50
50 -
 51
51 -
 52
52 -
 53
53 -
 54
54 -
55
-
56
-
57
-
58
 |
 |

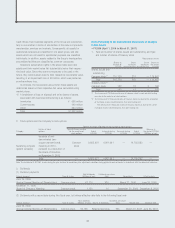
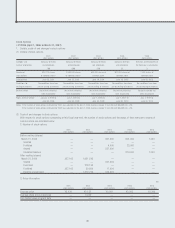
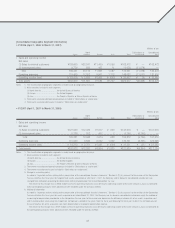
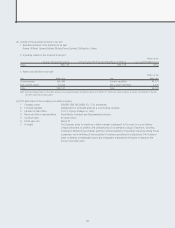
(2) Scale of and changes in stock options
With respect to stock options outstanding at this fiscal year end, the number of stock options and the status of their exercise to shares of
common stock are indicated below:
1) Number of stock options
2002 2004 2005 2005 2007 2007
stock options stock options stock options stock options stock options stock options
Before vesting (shares)
March 31, 2007 — — 879,000 7,000 — —
Granted — — — — 450,000 670,000
Forfeited — — — — — —
Vested — — 879,000 7,000 — —
Unvested balance — — — — 450,000 670,000
After vesting (shares)
March 31, 2007 1,372,750 540,000 — — — —
Vested — — 879,000 7,000 — —
Exercised 305,150 41,400 — — — —
Forfeited 10,200 33,000 51,000 1,000 — —
Balance unexercised 1,057,400 465,600 828,000 6,000 — —
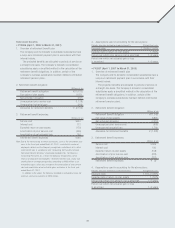
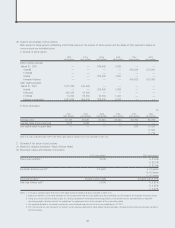
2) Price information
Yen
2002 2004 2005 2005 2007 2007
stock options stock options stock options stock options stock options stock options
Exercise price ¥2,152 ¥2,981 ¥3,365 ¥3,360 ¥3,706 ¥3,706
Average share price at exercise 3,572 3,582 — — — —
Fair market value on grant date — — — — 526 A. 526
B. 594
C. 715
Note: A, B and C indicated above refer to the three rights exercise periods A, B and C indicated in Table 2 (1).
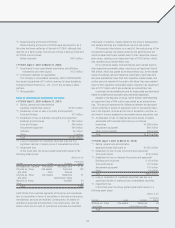
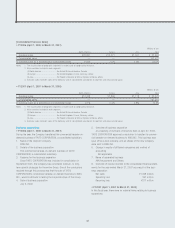
3. Estimate of fair value of stock options
(1) Method of valuation employed—Black–Scholes Model
(2) Main basic values and methods of estimation
2007 stock options 2007 stock options
Stock price volatility*2 24.0% A. 24.0%
B. 25.0%
C. 27.9%
Expected remaining period*3 3.5 years A. 3.5 years
B. 4.0 years
C. 4.5 years
Expected dividend*4 Dividend yield 0.99% Dividend yield 0.99%
Risk-free interest rate*5 0.87% A. 0.87%
B. 0.92%
C. 0.97%
Notes: 1. A, B and C indicated above refer to the three rights exercise periods A, B and C indicated in Table 2 (1).
2. Stock price volatility is calculated based on the actual stock price from the stock option grant date extending back the length of the expected remaining period.
3. Owing to a lack of sufficient historical data, it is difficult to determine the expected remaining period in a reasonable manner. Consequently, the expected
remaining period is determined to be the period from the option grant date to the mid-point of the exercisable period.
4. The expected dividend is calculated based on the actual dividend applicable to the fiscal year ended March 31, 2007.
5. The risk-free interest rate represents the interest rate of Japanese government bonds whose remaining periods correspond to the expected remaining periods of
the stock options.
42