Square Enix 2008 Annual Report Download - page 36
Download and view the complete annual report
Please find page 36 of the 2008 Square Enix annual report below. You can navigate through the pages in the report by either clicking on the pages listed below, or by using the keyword search tool below to find specific information within the annual report.-
 1
1 -
2
-
3
-
4
-
5
-
6
-
7
-
8
-
9
-
10
-
11
-
12
-
13
-
14
-
15
-
16
-
17
-
18
-
19
-
20
-
21
-
22
-
23
-
24
-
25
-
 26
26 -
 27
27 -
 28
28 -
 29
29 -
 30
30 -
 31
31 -
 32
32 -
 33
33 -
 34
34 -
 35
35 -
 36
36 -
 37
37 -
 38
38 -
 39
39 -
 40
40 -
 41
41 -
 42
42 -
 43
43 -
 44
44 -
 45
45 -
 46
46 -
47
-
48
-
49
-
50
-
51
-
52
-
53
-
54
-
55
-
56
-
57
-
58
 |
 |

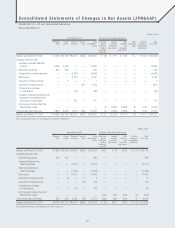
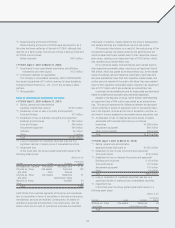
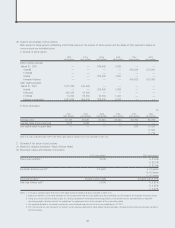
Items Pertaining to the Consolidated Statements of Changes
in Net Assets
• FY2006 (April 1, 2006 to March 31, 2007)
1. Type and number of shares issued and outstanding, and type
and number of shares of treasury stock
Thousands of shares
Shares at Share Share Shares at
the end of increases decreases the end of
FY2005 during the Year during the Year FY2006
Shares issued and
outstanding
Common stock*1 110,729 218 — 110,947
Total 110,729 218 — 110,947
Treasury stock*2
Common stock 182 12 0 193
Total 182 12 0 193
*1 The increase of 218 thousand shares of common stock issued and outstanding
was due to the exercise of stock options.
*2 The increase of 12 thousand shares of treasury stock was due to the acquisition
of fractional shares constituting less than one trading unit.
The decrease of 0 thousand shares of treasury stock was due to the sale of
fractional shares constituting less than one trading unit.
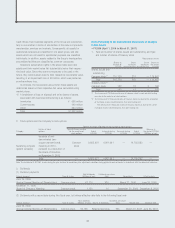
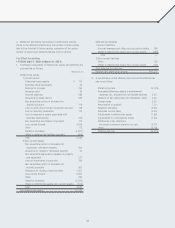
2. Stock options and the Company’s stock options
Number of shares allocated for the purpose of stock options
Details of stock Type of shares issuable Balance at
Category options for the exercise of End of Increase during Decrease during End of the end of FY2006
stock options FY2005 FY2006 FY2006 FY2006 (Millions of yen)
Issuance of yen-
denominated zero-
coupon warrant bonds Common 9,803,921 4,901,961 — 14,705,882 —
Supplying company maturing in 2010, stock
(parent company) pursuant to a resolution of
the Board of Directors
on November 9, 2005
Total — 9,803,921 4,901,961 — 14,705,882 —
Note: The increase of 4,901,961 shares during the year was due to conversion price adjustment conditions being applied to warrant bonds in accordance with the debenture indenture.
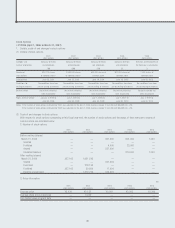
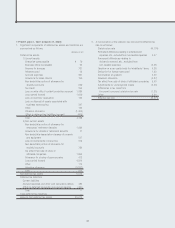
3. Dividends
(1) Dividend payments
Total dividends Dividends per share
Date of approval Type of shares (Millions of yen) (Yen) Record date Effective date
June 24, 2006
(Annual General Meeting of Shareholders) Common stock ¥2,210 ¥20 March 31, 2006 June 26, 2006
November 17, 2006
(Board of Directors’ Meeting) Common stock 1,150 10 September 30, 2006 December 8, 2006
(2) Dividends with a record date during this fiscal year, but whose effective date falls in the following fiscal year
Total dividends Dividends per share
Date of approval Type of shares (Millions of yen) Source of dividends (Yen) Record date Effective date
June 23, 2006
(Annual General Meeting of Shareholders) Common stock ¥2,768 Retained earnings ¥25 March 31, 2007 June 25, 2007
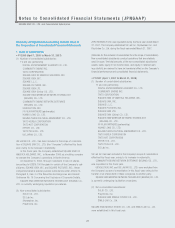
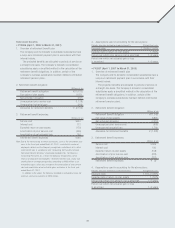
Cash inflows from business segments of the Group are complemen-
tary to one another in terms of similarities in the nature of products,
merchandise, services and markets. Consequently, all assets for
operational purposes are classified in one asset group, and idle
assets which are not used for operational purposes are classified
individually. In addition, assets related to the Group’s headquarters
and welfare facilities are classified as common-use assets.
Telephone subscription rights in the above table were idle
assets and their market value fell substantially below their respec-
tive book value. Since they were not expected to be used in the
future, they were marked down to their respective recoverable value,
resulting in an impairment loss of ¥9 million, which was posted as
an extraordinary loss.
In principle, the recoverable amounts for these assets are
determined based on their respective fair value calculated using
market prices.
*6 A breakdown of loss on disposal and write-downs of assets
associated with business restructuring is as follows:
Inventories ¥ 658 million
Current assets 249 million
Other 394 million
Total ¥1,302 million
34