Square Enix 2008 Annual Report Download - page 47
Download and view the complete annual report
Please find page 47 of the 2008 Square Enix annual report below. You can navigate through the pages in the report by either clicking on the pages listed below, or by using the keyword search tool below to find specific information within the annual report.-
 1
1 -
2
-
3
-
4
-
5
-
6
-
7
-
8
-
9
-
10
-
11
-
12
-
13
-
14
-
15
-
16
-
17
-
18
-
19
-
20
-
21
-
22
-
23
-
24
-
25
-
26
-
27
-
28
-
29
-
30
-
31
-
32
-
33
-
34
-
35
-
36
-
 37
37 -
 38
38 -
 39
39 -
 40
40 -
 41
41 -
 42
42 -
 43
43 -
 44
44 -
 45
45 -
 46
46 -
 47
47 -
 48
48 -
 49
49 -
 50
50 -
 51
51 -
 52
52 -
 53
53 -
 54
54 -
 55
55 -
 56
56 -
 57
57 -
58
 |
 |

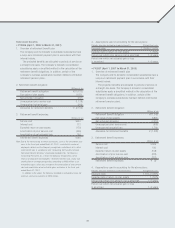
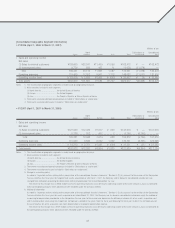
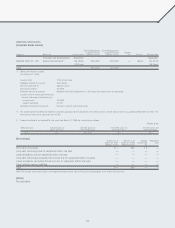
Segment Information
[Consolidated Business Segment Information]
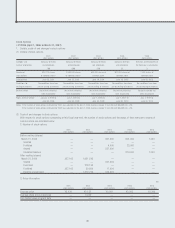
• FY2006 (April 1, 2006 to March 31, 2007)
Millions of yen
Games Games Mobile Phone Eliminations or Consolidated
(Offline) (Online) Content Publication Amusement Others Total unallocated total
I Sales and operating income
Net sales
(1) Sales to external customers ¥51,316 ¥13,660 ¥7,759 ¥11,208 ¥75,610 ¥3,915 ¥163,472 ¥ — ¥163,472
(2) Intersegment sales — — 7 — 91 62 161 (161) —
Total 51,316 13,660 7,767 11,208 75,702 3,978 163,634 (161) 163,472
Operating expenses 34,968 6,893 4,753 7,604 76,054 2,666 132,941 4,614 137,555
Operating income (loss) ¥16,348 ¥ 6,767 ¥3,013 ¥ 3,603 ¥ (351) ¥1,311 ¥ 30,693 ¥ (4,776) ¥ 25,916
II Total assets, depreciation and
amortization, impairment loss
and capital expenditures
Total assets ¥60,153 ¥18,062 ¥8,695 ¥ 9,544 ¥74,491 ¥7,865 ¥178,812 ¥36,866 ¥215,679
Depreciation and amortization 402 593 246 12 9,134 82 10,471 643 11,115
Impairment loss — — — — 368 — 368 — 368
Capital expenditures 428 411 79 22 9,477 108 10,528 832 11,360
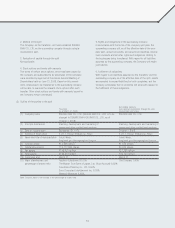
Notes: 1. The classification of business segments is made based on the types of products and services.
2. Major products offered by business segment are summarized as follows:
Segment Major Products
Games (Offline) Games
Games (Online) Online games
Mobile Phone Content Content for mobile phones
Publication Magazine comics, serial comics, game-related books
Amusement All businesses of the Taito Group including Amusement Operations and Rental,
Sales of Goods and Merchandise and Content Services
Others Derivative products such as character merchandise, school for game designers
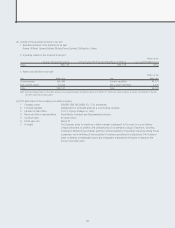
3. Unallocated operating expenses included in “Eliminations or unallocated” totaled ¥4,614 million. These expenses were related to administrative departments of the
Company which provide services and operational support that cannot be allocated to specific business segments.
4. Unallocated assets included in “Eliminations or unallocated” totaled ¥36,866 million. These assets mainly consisted of cash and deposits, deferred tax assets and
buildings and structures of administrative departments of the Company.
45