Square Enix 2008 Annual Report Download - page 29
Download and view the complete annual report
Please find page 29 of the 2008 Square Enix annual report below. You can navigate through the pages in the report by either clicking on the pages listed below, or by using the keyword search tool below to find specific information within the annual report.-
 1
1 -
2
-
3
-
4
-
5
-
6
-
7
-
8
-
9
-
10
-
11
-
12
-
13
-
14
-
15
-
16
-
17
-
18
-
 19
19 -
 20
20 -
 21
21 -
 22
22 -
 23
23 -
 24
24 -
 25
25 -
 26
26 -
 27
27 -
 28
28 -
 29
29 -
 30
30 -
 31
31 -
 32
32 -
 33
33 -
 34
34 -
 35
35 -
 36
36 -
 37
37 -
 38
38 -
 39
39 -
40
-
41
-
42
-
43
-
44
-
45
-
46
-
47
-
48
-
49
-
50
-
51
-
52
-
53
-
54
-
55
-
56
-
57
-
58
 |
 |

Millions of yen
2008 2007
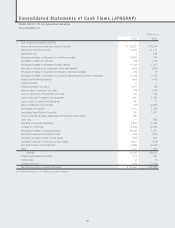
II Cash flows from investing activities
Investments in time deposits ¥ (62) ¥ —
Proceeds from time deposits 31 —
Payments for acquiring short-term securities (4,014) —
Proceeds from sale of short-term securities 4,014 —
Payments for acquiring investment securities (347) —
Proceeds from sale of investment securities 155 443
Payments for acquiring property and equipment (6,597) (10,733)
Proceeds from sale of property and equipment 59 —
Payments for acquiring intangible assets (259) (413)
Proceeds from sale of intangible assets 0 —
Payments for acquisition of shares in subsidiaries and affiliated companies (90) (63)
Proceeds from sale of shares in subsidiaries and an affiliated company 113 —
Proceeds from divestiture of a business 47 4,514
Proceeds from return of guarantee money deposited 1,903 1,113
Payments for provision of guarantee money (591) (398)
Other (168) (134)
Net cash used in investing activities (5,805) (5,671)
III Cash flows from financing activities
Proceeds from issuances of shares of common stock 780 438
Payments for acquisition of treasury stock (301) (37)
Payments for dividends (3,882) (3,314)
Payments for dividends for minority interests (2) (2)
Other 1 2
Net cash used in financing activities (3,404) (2,912)
IV Effect of exchange rate changes on cash and cash equivalents (2,756) 356
V Net increase in cash and cash equivalents 11,689 24,582
VI Cash and cash equivalents at beginning of the year 99,847 75,252
VII Cash and cash equivalents of newly consolidated subsidiaries 12 13
VIII Decrease in cash and cash equivalents due to exclusion of subsidiaries from the scope
of consolidation (70) —
IX Cash and cash equivalents at end of the year*1 ¥111,479 ¥ 99,847
The accompanying notes are an integral part of these statements.
27