Square Enix 2008 Annual Report Download - page 21
Download and view the complete annual report
Please find page 21 of the 2008 Square Enix annual report below. You can navigate through the pages in the report by either clicking on the pages listed below, or by using the keyword search tool below to find specific information within the annual report.-
 1
1 -
2
-
3
-
4
-
5
-
6
-
7
-
8
-
9
-
10
-
 11
11 -
 12
12 -
 13
13 -
 14
14 -
 15
15 -
 16
16 -
 17
17 -
 18
18 -
 19
19 -
 20
20 -
 21
21 -
 22
22 -
 23
23 -
 24
24 -
 25
25 -
 26
26 -
 27
27 -
 28
28 -
 29
29 -
 30
30 -
 31
31 -
32
-
33
-
34
-
35
-
36
-
37
-
38
-
39
-
40
-
41
-
42
-
43
-
44
-
45
-
46
-
47
-
48
-
49
-
50
-
51
-
52
-
53
-
54
-
55
-
56
-
57
-
58
 |
 |
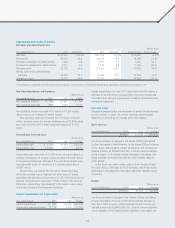
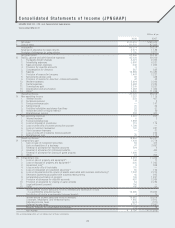
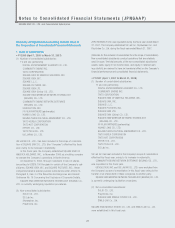
Consolidated Statements of Income
Net Sales and Operating Income
Millions of yen
Years ended March 31 2007 Composition 2008 Composition Amount change Percent change
Net sales ¥163,472 100.0% ¥147,516 100.0% ¥(15,955) (9.8)%
Gross profit 76,210 46.6 66,314 45.0 (9,895) (13.0)
Reversal of allowance for sales returns 1,186 0.8 2,271 1.5 1,084 91.4
Provision for allowance for sales returns 2,271 1.4 1,135 0.8 (1,135) (50.0)
Net gross profit 75,125 46.0 67,450 45.7 (7,675) (10.2)
Selling, general and administrative
expenses 49,209 30.1 45,929 31.1 (3,279) (6.7)
Operating income 25,916 15.9 21,520 14.6 (4,396) (17.0)
Comparisons by segment with the preceding fiscal year are provided in the section describing operating performance on pages 8–11.
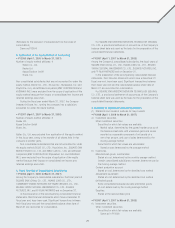
Non-Operating Income and Expenses
Millions of yen
Years ended March 31 2007 2008 Change
Non-operating income ¥1,176 ¥1,367 ¥ 190
Non-operating expenses 852 4,023 3,171
Non-operating income increased ¥190 million to ¥1,367 million,
mainly owing to an increase in interest income.
Non-operating expenses increased ¥3,171 million to ¥4,023
million, primarily owing to a foreign exchange loss of ¥1,858 million
and a loss on write-off of content production account of ¥1,799
million.
Extraordinary Gain and Loss
Millions of yen
Years ended March 31 2007 2008 Change
Extraordinary gain ¥ 3,778 ¥1,439 ¥(2,339)
Extraordinary loss 11,629 3,618 (8,011)
Extraordinary gain amounted to ¥1,439 million, primarily owing to a
reversal of allowance for closing of game arcades of ¥1,098 million.
In the previous fiscal year, disposal of the commercial karaoke busi-
ness generated a gain on divestiture of a business amounting to
¥2,697 million.
Extraordinary loss totaled ¥3,618 million. Significant items
within this included loss on disposal and write-downs of assets
associated with business restructuring of ¥1,302 million and loss on
disposal of property and equipment of ¥950 million. In the previous
fiscal year, extraordinary loss totaled ¥11,629 million, mainly owing
to the restructuring of the Amusement business.
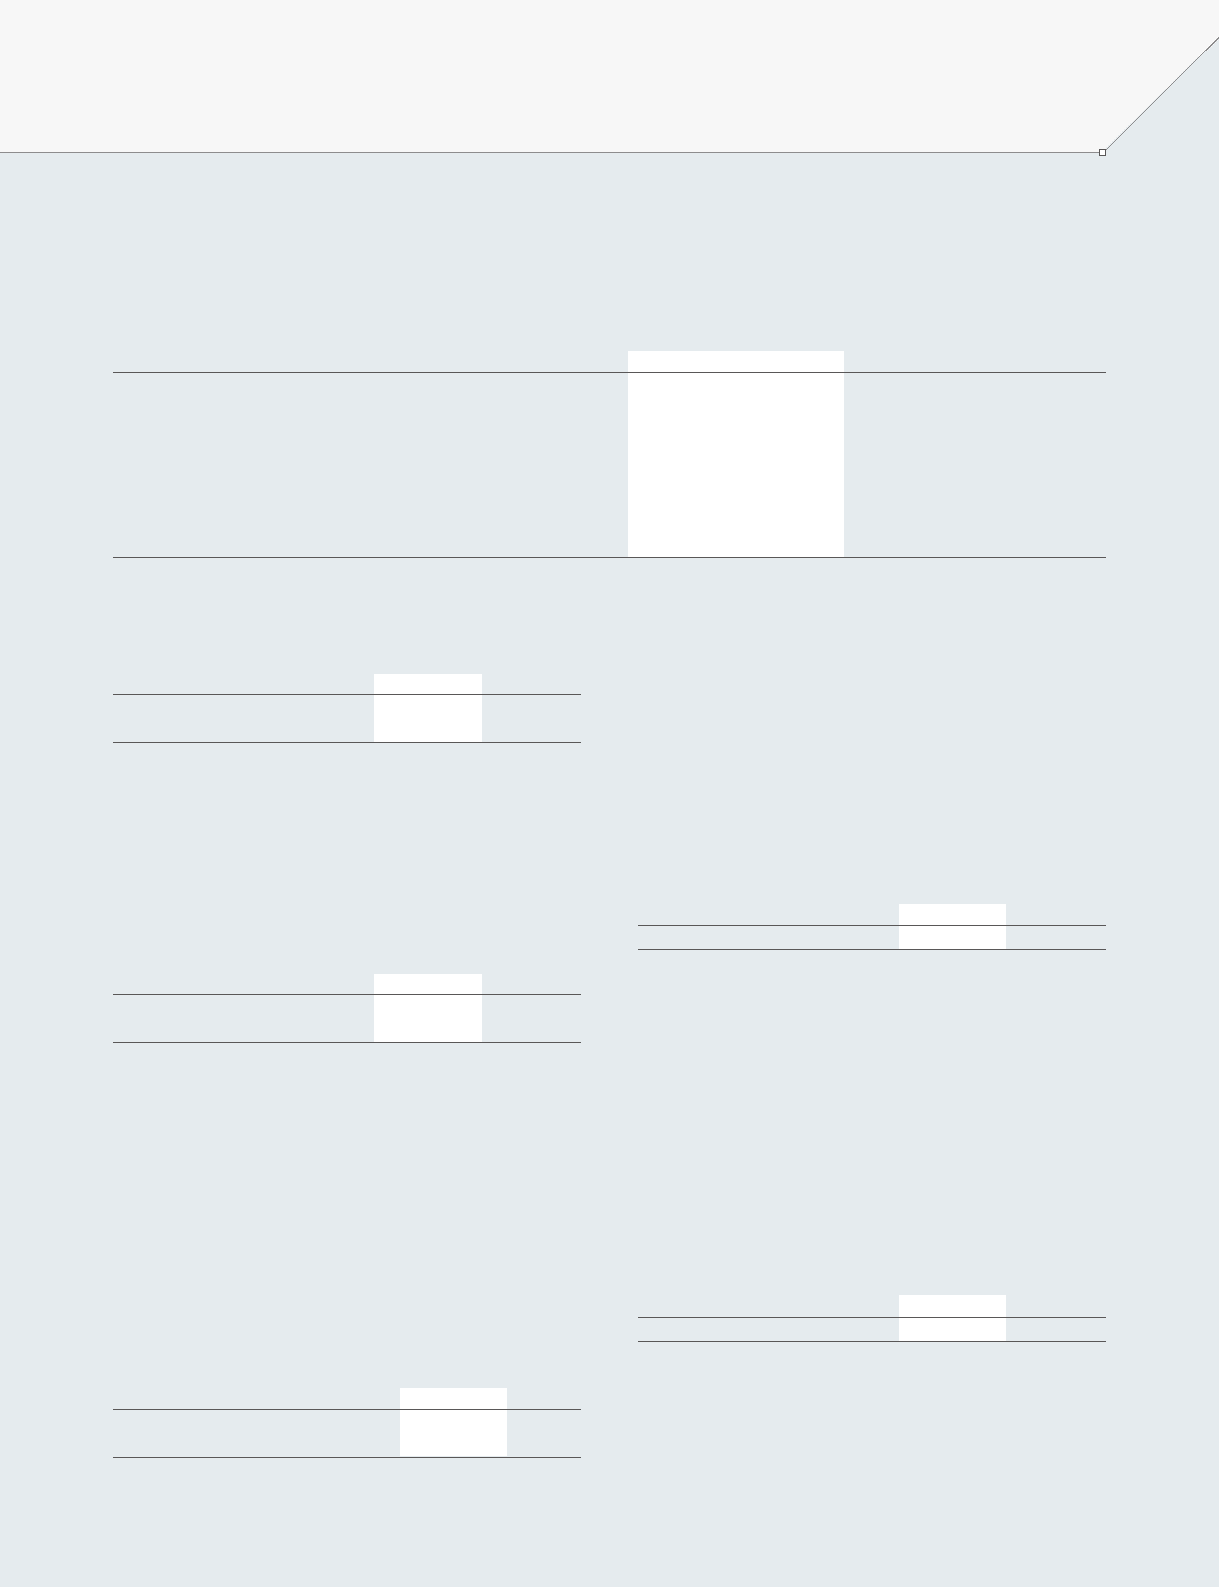
Capital Expenditures and Depreciation
Millions of yen
Years ended March 31 2007 2008 Change
Capital expenditures ¥11,360 ¥6,952 ¥(4,408)
Depreciation and amortization 11,115 9,933 (1,182)
Capital expenditures for fiscal 2007 amounted to ¥6,952 million, a
decrease of ¥4,408 million compared with the previous fiscal year.
This was mainly owing to a changeover to leasing contracts for new
amusement equipment.
Overseas Sales
Geographic segment sales are dependent on game title development
by the Company in Japan. As a result, overseas sales fluctuate
depending on the timing of overseas game title releases.
North America
Millions of yen
Years ended March 31 2007 2008 Change
¥23,801 ¥13,358 ¥(10,443)
The Group primarily is engaged in the Games (Offline) and Games
(Online) businesses in North America. In the Games (Offline) business
in this region, sales of game content developed by the Company are
handled primarily by SQUARE ENIX, INC., a wholly-owned subsidiary
of the Company. In the Games (Online) business in this region, the
Group provides online game services and sells software discs for
online games.
In the fiscal year under review, sales in North America totaled
¥13,358 million, a decrease of ¥10,443 million, which was mainly
attributable to the absence of any major game title releases during
the period.
Europe
Millions of yen
Years ended March 31 2007 2008 Change
¥12,271 ¥7,896 ¥(4,375)
The Group primarily is engaged in the Games (Offline) and Games
(Online) businesses in Europe. In the Games (Offline) business in
this region, sales of game content developed by the Company are
handled primarily by SQUARE ENIX LTD., a wholly-owned subsidiary
of the Company. In the Games (Online) business in this region, the
19