Square Enix 2008 Annual Report Download - page 26
Download and view the complete annual report
Please find page 26 of the 2008 Square Enix annual report below. You can navigate through the pages in the report by either clicking on the pages listed below, or by using the keyword search tool below to find specific information within the annual report.-
 1
1 -
2
-
3
-
4
-
5
-
6
-
7
-
8
-
9
-
10
-
11
-
12
-
13
-
14
-
15
-
 16
16 -
 17
17 -
 18
18 -
 19
19 -
 20
20 -
 21
21 -
 22
22 -
 23
23 -
 24
24 -
 25
25 -
 26
26 -
 27
27 -
 28
28 -
 29
29 -
 30
30 -
 31
31 -
 32
32 -
 33
33 -
 34
34 -
 35
35 -
 36
36 -
37
-
38
-
39
-
40
-
41
-
42
-
43
-
44
-
45
-
46
-
47
-
48
-
49
-
50
-
51
-
52
-
53
-
54
-
55
-
56
-
57
-
58
 |
 |

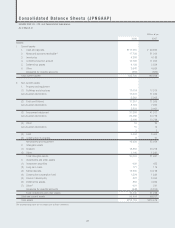
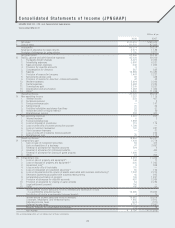
Consolidated Statements of Income (JPNGAAP)
SQUARE ENIX CO., LTD. and Consolidated Subsidiaries
Years ended March 31
Millions of yen
2008 2007
I Net sales ¥147,516 ¥163,472
II Cost of sales 81,201 87,262
Gross profit 66,314 76,210
Reversal of allowance for sales returns 2,271 1,186
Provision of allowance for sales returns 1,135 2,271
Net gross profit 67,450 75,125
III Selling, general and administrative expenses 45,929 49,209
1. Packaging freight charges 2,421 2,493
2. Advertising expenses 5,892 6,331
3. Sales promotion expenses 642 1,060
4. Provision for doubtful accounts 8 —
5. Compensation for directors 567 682
6. Salaries 15,889 15,482
7. Provision of reserve for bonuses 1,403 2,237
8. Net periodic pension cost 36 446
9. Provision of reserve for directors’ retirement benefits 47 42
10. Welfare expenses 2,024 2,046
11. Rental expenses 2,483 2,325
12. Commissions paid 3,209 3,357
13. Depreciation and amortization 1,463 1,464
14. Other*1 9,839 11,238
Operating income 21,520 25,916
IV Non-operating income 1,367 1,176
1. Interest income 959 467
2. Dividends received 2 3
3. Foreign exchange gain — 147
4. Rental income 70 69
5. Facilities installation assistance fund fees 52 51
6. Investment profit on equity method 23 29
7. Miscellaneous income 258 407
V Non-operating expenses 4,023 852
1. Interest expense 0 2
2. Foreign exchange loss 1,858 —
3. Loss on disposal of inventories 119 119
4. Loss on write-offs of content production account 1,799 —
5. Loss on inventory revaluation 170 281
6. Stock issuance expenses — 31
7. Loss on write-off of advance license payment — 244
8. Miscellaneous loss 75 172
Recurring income 18,864 26,241
VI Extraordinary gain 1,439 3,778
1. Gain on sale of investment securities 64 410
2. Gain on divestiture of a business 47 2,697
3. Reversal of allowance for doubtful accounts 204 2
4. Reversal of allowance for retirement benefits — 465
5. Reversal of allowance for closing of game arcades 1,098 —
6. Other 24 203
VII Extraordinary loss 3,618 11,629
1. Loss on sale of property and equipment*2 145 17
2. Loss on disposal of property and equipment*3 950 1,085
3. Impairment loss*5 9 368
4. Loss on write-offs of bad debts 170 —
5. Loss on revaluation of investment securities*4 55 194
6. Loss on disposal and write-downs of assets associated with business restructuring*6 1,302 2,275
7. Severance payments associated with business restructuring 45 925
8. Accelerated amortization of goodwill 136 1,831
9. Provision of allowance for doubtful accounts 452 2,086
10. Provision of allowance for closing of game arcades 54 2,784
11. Legal settlement payment 156 —
12. Other 140 60
Income before income taxes and minority interests and distribution of loss
in a partnership (tokumei-kumiai ) 16,685 18,390
Distribution of loss in a partnership (tokumei-kumiai ) 4 16
Income before income taxes and minority interests 16,681 18,374
Corporate, inhabitants’ and enterprise taxes 1,865 2,915
Refunded income taxes (424) (127)
Deferred income taxes 6,116 3,941
Minority interests in consolidated subsidiaries (73) 24
Net income ¥ 9,196 ¥ 11,619
The accompanying notes are an integral part of these statements.
24