Square Enix 2008 Annual Report Download - page 35
Download and view the complete annual report
Please find page 35 of the 2008 Square Enix annual report below. You can navigate through the pages in the report by either clicking on the pages listed below, or by using the keyword search tool below to find specific information within the annual report.-
 1
1 -
2
-
3
-
4
-
5
-
6
-
7
-
8
-
9
-
10
-
11
-
12
-
13
-
14
-
15
-
16
-
17
-
18
-
19
-
20
-
21
-
22
-
23
-
24
-
 25
25 -
 26
26 -
 27
27 -
 28
28 -
 29
29 -
 30
30 -
 31
31 -
 32
32 -
 33
33 -
 34
34 -
 35
35 -
 36
36 -
 37
37 -
 38
38 -
 39
39 -
 40
40 -
 41
41 -
 42
42 -
 43
43 -
 44
44 -
 45
45 -
46
-
47
-
48
-
49
-
50
-
51
-
52
-
53
-
54
-
55
-
56
-
57
-
58
 |
 |

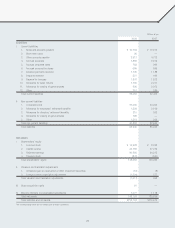
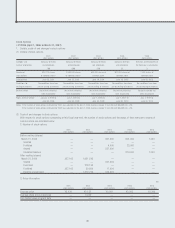
*3 Notes maturing at the end of FY2006:
Notes maturing at the end of FY2006 were accounted for as if
the notes had been settled as of the end of FY2006, although that
date fell on a bank holiday. The amount of notes maturing at the end
of FY2006 was as follows:
Notes receivable ¥410 million
• FY2007 (April 1, 2007 to March 31, 2008)
*1 Investments in non-consolidated subsidiaries and affiliates:
Investments and other assets ¥173 million
*2 Contingent liabilities for guarantees:
The Company’s consolidated subsidiary, TAITO CORPORATION,
has issued a guarantee of ¥1 million covering its lease obligations
to Diamond Asset Finance Co., Ltd., one of the Company’s sales
partners.
*3 Not applicable
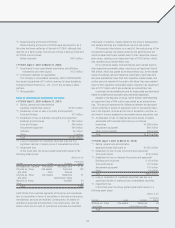
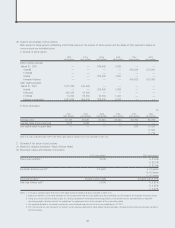
Notes to Consolidated Statements of Income
• FY2006 (April 1, 2006 to March 31, 2007)
*1 Selling, general and administrative
expenses include R&D costs of ¥2,374 million
*2 Breakdown of loss on sale of property and equipment
Tools and fixtures ¥17 million
*3 Breakdown of loss on disposal of property and equipment
Buildings and structures ¥ 269 million
Tools and fixtures 266 million
Amusement equipment 484 million
Software 56 million
Other 7 million
Total ¥1,085 million
*4 Loss on revaluation of investment securities was due to a
significant decline in market prices of marketable securities.
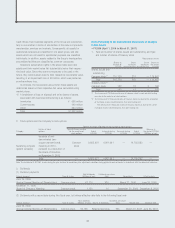
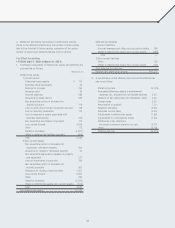
*5 Impairment loss
In this fiscal year, the Group posted impairment losses on the
following asset groups:
Millions of yen
Impairment
Location Usage Category amount
Kumagaya-shi, Saitama Idle assets Buildings, land ¥ 91
Chiyoda-ku, Tokyo Idle assets, Tools and 169
and other other fixtures
Chiyoda-ku, Tokyo Idle assets Telephone 21
and other subscription rights
Republic of Korea Goodwill 40
Other 44
Total ¥368
Cash inflows from business segments of the Group are complemen-
tary to one another in terms of similarities in the nature of products,
merchandise, services and markets. Consequently, all assets for
operational purposes are classified in one asset group, and idle
assets which are not used for operational purposes are classified
individually. In addition, assets related to the Group’s headquarters
and welfare facilities are classified as common-use assets.
Of the assets listed above, as a result of the restructuring of the
amusement business, the assets owned by the pachinko and slot
machine department were marked down to their respective recover-
able values, resulting in an impairment loss of ¥102 million, which
was recorded as an extraordinary loss.
For e-commerce assets, tools and fixtures were marked down to
their respective recoverable values, resulting in an impairment loss of
¥66 million, which was posted as an extraordinary loss. As the market
values of buildings, land and telephone subscription rights that were
idle were substantially lower than their respective market values, and
as they were not expected to be used in the future, they were marked
down to their respective recoverable values, resulting in an impairment
loss of ¥112 million, which was posted as an extraordinary loss.
In principle, the recoverable amounts for these assets are determined
based on market prices calculated using real estate appraisals.
Related to the Republic of Korea (TAITO KOREA CORPORATION),
an impairment loss of ¥40 million was posted as an extraordinary
loss. This amount represents the difference between the appraised
income potential in excess of acquisition cost for amusement facili-
ties in the Republic of Korea at the time of acquisition, and the cur-
rent level of income assessed as recoverable above acquisition cost.
*6 A breakdown of loss on disposal and write-downs of assets
associated with business restructuring is as follows:
Inventories ¥1,368 million
Amusement equipment 666 million
Other (current assets) 239 million
Total ¥2,275 million
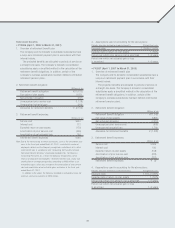
• FY2007 (April 1, 2007 to March 31, 2008)
*1 Selling, general and administrative
expenses include R&D costs of ¥1,581 million
*2 Breakdown of loss on sale of property and equipment
Tools and fixtures ¥145 million
*3 Breakdown of loss on disposal of property and equipment
Buildings and structures ¥ 62 million
Tools and fixtures 131 million
Amusement equipment 741 million
Other 15 million
Total ¥950 million
*4 Loss on revaluation of investment securities was due to a
significant decline in market prices of marketable securities.
*5 Impairment loss
In this fiscal year, the Group posted impairment losses on a
following asset group:
Millions of yen
Impairment
Location Usage Category amount
Shibuya-ku, Tokyo Idle assets Telephone ¥9
and other subscription rights
Total ¥9
33