SkyWest Airlines 2002 Annual Report Download - page 18
Download and view the complete annual report
Please find page 18 of the 2002 SkyWest Airlines annual report below. You can navigate through the pages in the report by either clicking on the pages listed below, or by using the keyword search tool below to find specific information within the annual report.-
 1
1 -
2
-
3
-
4
-
5
-
6
-
7
-
 8
8 -
 9
9 -
 10
10 -
 11
11 -
 12
12 -
 13
13 -
 14
14 -
 15
15 -
 16
16 -
 17
17 -
 18
18 -
 19
19 -
 20
20 -
 21
21 -
 22
22 -
 23
23 -
 24
24 -
 25
25 -
 26
26 -
 27
27 -
 28
28 -
29
-
30
-
31
-
32
-
33
-
34
-
35
-
36
-
37
-
38
-
39
-
40
-
41
-
42
-
43
-
44
-
45
-
46
-
47
-
48
-
49
-
50
-
51
-
52
-
53
-
54
-
55
-
56
-
57
-
58
-
59
-
60
-
61
-
62
 |
 |

Year Ended December 31,
2002 2001 2000 1999 1998
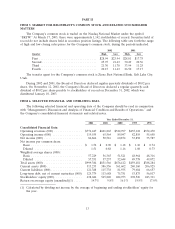
Operating Data (unaudited):
Passengers carried ................... 8,388,935 6,229,867 5,598,499 5,446,872 4,422,328
Revenue passenger miles (000) .......... 2,990,753 1,732,180 1,277,001 1,161,918 938,172
Available seat miles (000) .............. 4,356,053 2,837,278 2,256,635 2,100,062 1,712,333
Load factor ........................ 68.7% 61.1% 56.6% 55.3% 54.8%
Break-even load factor ................ 58.4% 54.4% 47.2% 45.6% 46.5%
Yield per revenue passenger mile ........ 25.73¢ 34.41¢ 40.42¢ 38.46¢ 36.85¢
Revenue per available seat mile ......... 17.78¢ 21.21¢ 23.18¢ 21.67¢ 21.20¢
Cost per available seat mile ............ 15.12¢ 18.90¢ 19.23¢ 17.71¢ 17.70¢
Average passenger trip length ........... 356 278 228 213 212
Number of aircraft at end of year ........ 149 131 107 102 60
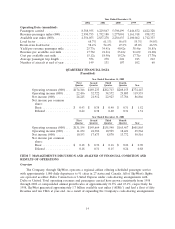
QUARTERLY FINANCIAL DATA
(Unaudited)
Year Ended December 31, 2002
First Second Third Fourth
Quarter Quarter Quarter Quarter Year
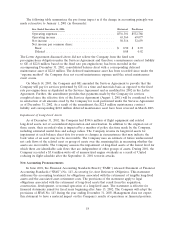
Operating revenues (000) . . . $174,346 $189,233 $202,713 $208,155 $774,447
Operating income (000) .... 22,456 32,722 34,572 29,805 119,555
Net income (000) ........ 24,245 21,912 22,923 17,786 86,866
Net income per common
share:
Basic ................ $ 0.43 $ 0.38 $ 0.40 $ 0.31 $ 1.52
Diluted .............. 0.42 0.38 0.40 0.31 1.51
Year Ended December 31, 2001
First Second Third Fourth
Quarter Quarter Quarter Quarter Year
Operating revenues (000) . . . $131,194 $149,664 $155,540 $165,467 $601,865
Operating income (000) .... 11,232 24,986 10,925 18,421 65,564
Net income (000) ........ 10,193 17,673 8,878 13,772 50,516
Net income per common
share:
Basic ................ $ 0.18 $ 0.32 $ 0.16 $ 0.24 $ 0.90
Diluted .............. 0.18 0.31 0.15 0.24 0.88
ITEM 7. MANAGEMENT’S DISCUSSION AND ANALYSIS OF FINANCIAL CONDITION AND
RESULTS OF OPERATIONS
Overview
The Company, through SkyWest, operates a regional airline offering scheduled passenger service
with approximately 1,000 daily departures to 91 cities in 27 states and Canada. All of SkyWest’s flights
are operated as either Delta Connection or United Express under code-sharing arrangements with
Delta or United. Total operating revenues and passengers carried have grown consistently from 1998
through 2002 at compounded annual growth rates of approximately 21.8% and 23.1%, respectively. In
1998, SkyWest generated approximately 1.7 billion available seat miles (‘‘ASMs’’) and had a fleet of fifty
Brasilias and ten CRJs at year-end. As a result of expanding the Company’s code-sharing arrangements
14