SkyWest Airlines 2002 Annual Report Download - page 17
Download and view the complete annual report
Please find page 17 of the 2002 SkyWest Airlines annual report below. You can navigate through the pages in the report by either clicking on the pages listed below, or by using the keyword search tool below to find specific information within the annual report.-
 1
1 -
2
-
3
-
4
-
5
-
6
-
 7
7 -
 8
8 -
 9
9 -
 10
10 -
 11
11 -
 12
12 -
 13
13 -
 14
14 -
 15
15 -
 16
16 -
 17
17 -
 18
18 -
 19
19 -
 20
20 -
 21
21 -
 22
22 -
 23
23 -
 24
24 -
 25
25 -
 26
26 -
 27
27 -
28
-
29
-
30
-
31
-
32
-
33
-
34
-
35
-
36
-
37
-
38
-
39
-
40
-
41
-
42
-
43
-
44
-
45
-
46
-
47
-
48
-
49
-
50
-
51
-
52
-
53
-
54
-
55
-
56
-
57
-
58
-
59
-
60
-
61
-
62
 |
 |

PART II
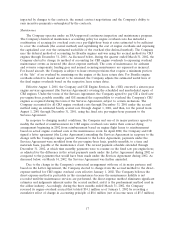
ITEM 5. MARKET FOR REGISTRANT’S COMMON STOCK AND RELATED STOCKHOLDER
MATTERS
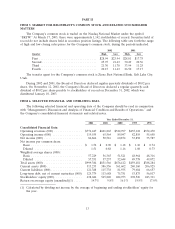
The Company’s common stock is traded on the Nasdaq National Market under the symbol
‘‘SKYW.’’ At March 17, 2003, there were approximately 1,142 stockholders of record. Securities held of
record do not include shares held in securities position listings. The following table sets forth the range
of high and low closing sales prices for the Company’s common stock, during the periods indicated.
2002 2001
Quarter High Low High Low
First ................................. $28.94 $23.94 $28.81 $17.75
Second ............................... 25.95 21.43 30.49 20.56
Third ................................ 21.30 11.78 33.94 11.25
Fourth ............................... 20.15 11.43 26.50 17.17
The transfer agent for the Company’s common stock is Zions First National Bank, Salt Lake City,
Utah.
During 2002 and 2001, the Board of Directors declared regular quarterly dividends of $0.02 per
share. On November 12, 2002, the Company’s Board of Directors declared a regular quarterly cash
dividend of $0.02 per share payable to stockholders of record on December 31, 2002, which was
distributed January 10, 2003.
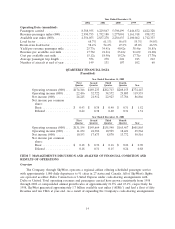
ITEM 6. SELECTED FINANCIAL AND OPERATING DATA
The following selected financial and operating data of the Company should be read in conjunction
with ‘‘Management’s Discussion and Analysis of Financial Condition and Results of Operations,’’ and
the Company’s consolidated financial statements and related notes.
Year Ended December 31,
2002 2001 2000 1999 1998
Consolidated Financial Data:
Operating revenues (000) ................ $774,447 $601,865 $522,997 $455,122 $352,470
Operating income (000) ................. 119,555 65,564 89,047 82,819 55,658
Net income (000) ...................... 86,866 50,516 60,874 53,858 35,787
Net income per common share:
Basic ............................. $ 1.52 $ 0.90 $ 1.18 $ 1.10 $ 0.74
Diluted ........................... 1.51 0.88 1.16 1.08 0.73
Weighted average shares (000):
Basic ............................. 57,229 56,365 51,521 48,964 48,316
Diluted ........................... 57,551 57,237 52,644 49,778 49,072
Total assets (000) ...................... $999,384 $831,566 $676,412 $459,481 $388,284
Current assets (000) .................... 513,233 386,556 361,602 240,160 206,925
Current liabilities (000) .................. 121,388 115,738 81,935 79,684 66,657
Long-term debt, net of current maturities (000) 125,379 113,688 75,751 53,873 56,817
Stockholders’ equity (000) ................ 638,686 545,840 484,953 298,526 243,311
Return on average equity (unaudited)(1) ..... 14.7% 9.8% 16.1% 19.9% 17.0%
(1) Calculated by dividing net income by the average of beginning and ending stockholders’ equity for
the year.
13