Singapore Airlines 2004 Annual Report Download - page 89
Download and view the complete annual report
Please find page 89 of the 2004 Singapore Airlines annual report below. You can navigate through the pages in the report by either clicking on the pages listed below, or by using the keyword search tool below to find specific information within the annual report.-
 1
1 -
2
-
3
-
4
-
5
-
6
-
7
-
8
-
9
-
10
-
11
-
12
-
13
-
14
-
15
-
16
-
17
-
18
-
19
-
20
-
21
-
22
-
23
-
24
-
25
-
26
-
27
-
28
-
29
-
30
-
31
-
32
-
33
-
34
-
35
-
36
-
37
-
38
-
39
-
40
-
41
-
42
-
43
-
44
-
45
-
46
-
47
-
48
-
49
-
50
-
51
-
52
-
53
-
54
-
55
-
56
-
57
-
58
-
59
-
60
-
61
-
62
-
63
-
64
-
65
-
66
-
67
-
68
-
69
-
70
-
71
-
72
-
73
-
74
-
75
-
76
-
77
-
78
-
 79
79 -
 80
80 -
 81
81 -
 82
82 -
 83
83 -
 84
84 -
 85
85 -
 86
86 -
 87
87 -
 88
88 -
 89
89 -
 90
90 -
 91
91 -
 92
92 -
 93
93 -
 94
94 -
 95
95 -
 96
96 -
 97
97 -
 98
98 -
 99
99 -
100
-
101
-
102
-
103
-
104
-
105
-
106
-
107
-
108
-
109
-
110
-
111
-
112
-
113
-
114
-
115
-
116
-
117
-
118
-
119
-
120
-
121
-
122
-
123
-
124
-
125
-
126
-
127
-
128
-
129
-
130
-
131
-
132
 |
 |

87
SIA Annual Report 03/04
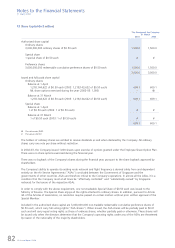
Notes to the Financial Statements
31 March 2004
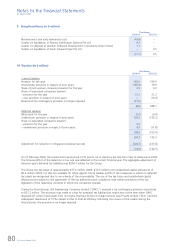
15 Deferred Taxation (in $ million)
The Group The Company
31 March 31 March
2004 2003 2004 2003
––––––––––––––––––––––––––––––––––––––––––––––––––––––––––––––––––––
Balance at 1 April 2,251.0 2,664.5 1,807.9 2,205.9
Written-back during the year (5.2) (9.4) (46.2) (36.3)
Adjustment for reduction in Singapore statutory tax rate (204.7) (271.9) (164.4) (225.1)
Under/(over) provision in respect of prior years 134.2 (132.2) 144.8 (136.6)
––––––––––––––––––––––––––––––––––––––––––––––––––––––––––––––––––––
Balance at 31 March 2,175.3 2,251.0 1,742.1 1,807.9
––––––––––––––––––––––––––––––––––––––––––––––––––––––––––––––––––––
The deferred taxation arises as a result of:
Deferred tax liabilities
An excess of net book value over tax written
down value of fixed assets 2,231.8 2,341.1 1,686.9 1,773.5
Other taxable temporary differences 109.1 127.0 101.0 107.0
––––––––––––––––––––––––––––––––––––––––––––––––––––––––––––––––––––
Gross deferred tax liabilities 2,340.9 2,468.1 1,787.9 1,880.5
Deferred tax assets
Unabsorbed capital allowances and tax losses 89.2 117.8 – –
Other deductible temporary differences 76.4 99.3 45.8 72.6
––––––––––––––––––––––––––––––––––––––––––––––––––––––––––––––––––––
Gross deferred tax assets 165.6 217.1 45.8 72.6
––––––––––––––––––––––––––––––––––––––––––––––––––––––––––––––––––––
Net deferred tax liabilities 2,175.3 2,251.0 1,742.1 1,807.9
––––––––––––––––––––––––––––––––––––––––––––––––––––––––––––––––––––
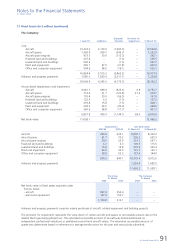
16 Long-Term Liabilities (in $ million)
The Group The Company
31 March 31 March
2004 2003 2004 2003
––––––––––––––––––––––––––––––––––––––––––––––––––––––––––––––––––––––––––––––––––––––––––––––––––––––––––––––––––––––––––––––––––––––––––––––––––––
Notes payable 900.0 1,100.0 900.0 900.0
Repayable within one year – (200.0) – –
––––––––––––––––––––––––––––––––––––––––––––––––––––––––––––––––––––
Repayable after one year 900.0 900.0 900.0 900.0
––––––––––––––––––––––––––––––––––––––––––––––––––––––––––––––––––––
Loans 192.2 222.9 – –
Repayable within one year (24.8) (24.7) – –
––––––––––––––––––––––––––––––––––––––––––––––––––––––––––––––––––––
Repayable after one year 167.4 198.2 – –
––––––––––––––––––––––––––––––––––––––––––––––––––––––––––––––––––––
Finance lease commitments 1,181.3 794.4 557.0 583.9
Repayable within one year (41.5) (13.0) – –
––––––––––––––––––––––––––––––––––––––––––––––––––––––––––––––––––––
Repayable after one year 1,139.8 781.4 557.0 583.9
––––––––––––––––––––––––––––––––––––––––––––––––––––––––––––––––––––
Total repayable after one year 2,207.2 1,879.6 1,457.0 1,483.9
––––––––––––––––––––––––––––––––––––––––––––––––––––––––––––––––––––