Singapore Airlines 2004 Annual Report Download - page 80
Download and view the complete annual report
Please find page 80 of the 2004 Singapore Airlines annual report below. You can navigate through the pages in the report by either clicking on the pages listed below, or by using the keyword search tool below to find specific information within the annual report.-
 1
1 -
2
-
3
-
4
-
5
-
6
-
7
-
8
-
9
-
10
-
11
-
12
-
13
-
14
-
15
-
16
-
17
-
18
-
19
-
20
-
21
-
22
-
23
-
24
-
25
-
26
-
27
-
28
-
29
-
30
-
31
-
32
-
33
-
34
-
35
-
36
-
37
-
38
-
39
-
40
-
41
-
42
-
43
-
44
-
45
-
46
-
47
-
48
-
49
-
50
-
51
-
52
-
53
-
54
-
55
-
56
-
57
-
58
-
59
-
60
-
61
-
62
-
63
-
64
-
65
-
66
-
67
-
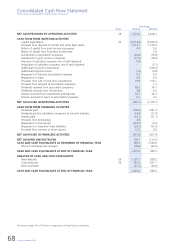
68
-
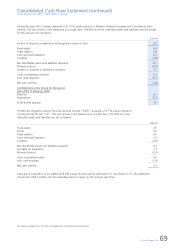
69
-
 70
70 -
 71
71 -
 72
72 -
 73
73 -
 74
74 -
 75
75 -
 76
76 -
 77
77 -
 78
78 -
 79
79 -
 80
80 -
 81
81 -
 82
82 -
 83
83 -
 84
84 -
 85
85 -
 86
86 -
 87
87 -
 88
88 -
 89
89 -
 90
90 -
91
-
92
-
93
-
94
-
95
-
96
-
97
-
98
-
99
-
100
-
101
-
102
-
103
-
104
-
105
-
106
-
107
-
108
-
109
-
110
-
111
-
112
-
113
-
114
-
115
-
116
-
117
-
118
-
119
-
120
-
121
-
122
-
123
-
124
-
125
-
126
-
127
-
128
-
129
-
130
-
131
-
132
 |
 |

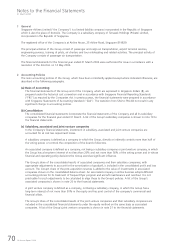
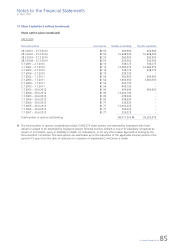
78 SIA Annual Report 03/04
Notes to the Financial Statements
31 March 2004
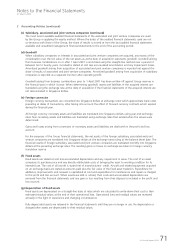
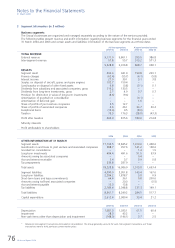
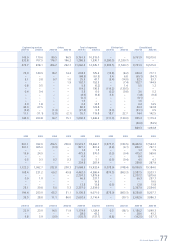
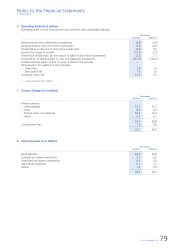
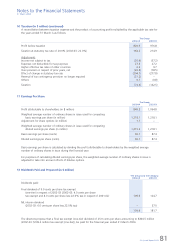
3 Segment Information (in $ million) (continued)
Geographical segments
The following table presents revenue information on airline operations by geographical areas for the financial years
ended 31 March 2004 and 2003.
By area of original sale
2003-04 2002-03
––––––––––––––––––––––––––––––––––––––––––––––––––––––––––––––––––––––––––––––––––––––––––––––––––––––––––––––––––––––––––––––––––––––––––––––––––––
East Asia 4,452.5 4,929.9
Europe 1,708.6 1,807.6
South West Pacific 1,096.9 1,037.7
Americas 649.4 804.7
West Asia and Africa 667.7 722.2
––––––––––––––––––––––––––––––––
System-wide 8,575.1 9,302.1
Non-scheduled services and incidental revenue 653.7 614.7
––––––––––––––––––––––––––––––––
9,228.8 9,916.8
––––––––––––––––––––––––––––––––
4 Revenue (in $ million)
Revenue earned is generated principally from the carriage of passengers, cargo and mail, the rendering of airport
terminal services, engineering services, training of pilots, air charters and tour wholesaling and related activities.
Revenue for the Group excludes dividends from subsidiary companies and inter-company transactions.
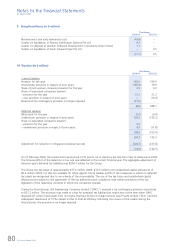
5 Staff Costs (in $ million)
The Group
2003-04 2002-03
––––––––––––––––––––––––––––––––––––––––––––––––––––––––––––––––––––––––––––––––––––––––––––––––––––––––––––––––––––––––––––––––––––––––––––––––––––––
Staff costs (including Executive Director)
Salary, bonuses and other costs 1,828.2 2,091.0
CPF and other defined contributions 141.3 154.2
––––––––––––––––––––––––––––––––
1,969.5 2,245.2
––––––––––––––––––––––––––––––––
The number of employees of the Group at 31 March 2004 are 28,786 (2003: 30,681).
The Group contributes to several post-employment defined benefit plans for employees at several overseas locations.
Employees may contribute in some of these plans and these contributions are matched in varying amounts by the
Group. Defined benefit expenses for the Group were $7.6 million for 2003-04 and $26.7 million for 2002-03. As these
are not material to the total staff costs of the Group for 2003-04 and 2002-03, additional disclosures of these defined
benefit plans are not shown.