Singapore Airlines 2004 Annual Report Download - page 45
Download and view the complete annual report
Please find page 45 of the 2004 Singapore Airlines annual report below. You can navigate through the pages in the report by either clicking on the pages listed below, or by using the keyword search tool below to find specific information within the annual report.-
 1
1 -
2
-
3
-
4
-
5
-
6
-
7
-
8
-
9
-
10
-
11
-
12
-
13
-
14
-
15
-
16
-
17
-
18
-
19
-
20
-
21
-
22
-
23
-
24
-
25
-
26
-
27
-
28
-
29
-
30
-
31
-
32
-
33
-
34
-
 35
35 -
 36
36 -
 37
37 -
 38
38 -
 39
39 -
 40
40 -
 41
41 -
 42
42 -
 43
43 -
 44
44 -
 45
45 -
 46
46 -
 47
47 -
 48
48 -
 49
49 -
 50
50 -
 51
51 -
 52
52 -
 53
53 -
 54
54 -
 55
55 -
56
-
57
-
58
-
59
-
60
-
61
-
62
-
63
-
64
-
65
-
66
-
67
-
68
-
69
-
70
-
71
-
72
-
73
-
74
-
75
-
76
-
77
-
78
-
79
-
80
-
81
-
82
-
83
-
84
-
85
-
86
-
87
-
88
-
89
-
90
-
91
-
92
-
93
-
94
-
95
-
96
-
97
-
98
-
99
-
100
-
101
-
102
-
103
-
104
-
105
-
106
-
107
-
108
-
109
-
110
-
111
-
112
-
113
-
114
-
115
-
116
-
117
-
118
-
119
-
120
-
121
-
122
-
123
-
124
-
125
-
126
-
127
-
128
-
129
-
130
-
131
-
132
 |
 |

43
SIA Annual Report 03/04
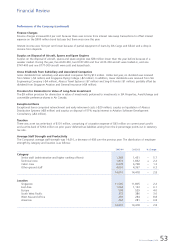
Performance of the Group (continued)
Financial Position of the Group
The Group’s total assets stood at $19,990 million on 31 March 2004, up 4.2 per cent compared to 31 March 2003. Net
asset value per share improved 6.9 per cent to $9.40.
Shareholders’ funds of the Group increased by 7.0 per cent to $11,455 million as at 31 March 2004.
Net debt declined 61.5 per cent to $277 million mainly due to a stronger cash position (+$699 million). Total debt was
$2,274 million, an increase of 7.4 per cent over the previous year. Total debt to equity ratio remained unchanged at
0.20 times.
Capital Expenditure and Cash Flow of the Group
Capital expenditure was $2,693 million, 12.8 per cent lower than the year before. Internally generated cash flow of $3,341
million was 1.24 times capital expenditure. About 94 per cent of the capital spending was on aircraft delivered during the
year, together with spare engines and components. In addition, progress payments were made for aircraft scheduled for
delivery between 2004 and 2009.
Financial Review
10
8
6
4
2
0
Group Shareholders’ Funds, Total Assets
and Net Asset Value (NAV) Per Share
Dollars
$ Million
2000 2001 2002 2003 2004
31 March
Shareholders’ Funds ($ Million)
Total Assets ($ Million)
NAV Per Share ($)
25,000
20,000
15,000
10,000
5,000
0
2,000
1,500
1,000
500
0
-500
-1,000
Group Net Liquid Assets and Net Debt
$ Million
$ Million
2000 2001 2002 2003 2004
31 March
Net Liquid Assets
Net Debt
2,000
1,500
1,000
500
0
-500
-1,000
1.7
1.4
1.1
0.8
0.5
Group Capital Expenditure and
Internally Generated Cash Flow
Ratio
$ Million
Other Capital Expenditure ($ Million)
Capital Expenditure on Aircraft,
Engines and Spares ($ Million)
Internally Generated Cash Flow ($ Million)
Cash Flow: Capital Expenditure Ratio
4,000
3,000
2,000
1,000
0
1999-00 2000-01 2001-02 2002-03 2003-04