Singapore Airlines 2004 Annual Report Download - page 88
Download and view the complete annual report
Please find page 88 of the 2004 Singapore Airlines annual report below. You can navigate through the pages in the report by either clicking on the pages listed below, or by using the keyword search tool below to find specific information within the annual report.-
 1
1 -
2
-
3
-
4
-
5
-
6
-
7
-
8
-
9
-
10
-
11
-
12
-
13
-
14
-
15
-
16
-
17
-
18
-
19
-
20
-
21
-
22
-
23
-
24
-
25
-
26
-
27
-
28
-
29
-
30
-
31
-
32
-
33
-
34
-
35
-
36
-
37
-
38
-
39
-
40
-
41
-
42
-
43
-
44
-
45
-
46
-
47
-
48
-
49
-
50
-
51
-
52
-
53
-
54
-
55
-
56
-
57
-
58
-
59
-
60
-
61
-
62
-
63
-
64
-
65
-
66
-
67
-
68
-
69
-
70
-
71
-
72
-
73
-
74
-
75
-
76
-
77
-
 78
78 -
 79
79 -
 80
80 -
 81
81 -
 82
82 -
 83
83 -
 84
84 -
 85
85 -
 86
86 -
 87
87 -
 88
88 -
 89
89 -
 90
90 -
 91
91 -
 92
92 -
 93
93 -
 94
94 -
 95
95 -
 96
96 -
 97
97 -
 98
98 -
99
-
100
-
101
-
102
-
103
-
104
-
105
-
106
-
107
-
108
-
109
-
110
-
111
-
112
-
113
-
114
-
115
-
116
-
117
-
118
-
119
-
120
-
121
-
122
-
123
-
124
-
125
-
126
-
127
-
128
-
129
-
130
-
131
-
132
 |
 |

86 SIA Annual Report 03/04
Notes to the Financial Statements
31 March 2004
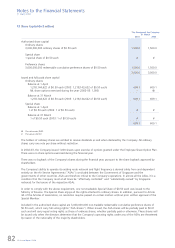
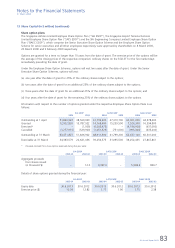
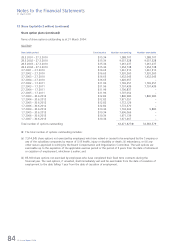
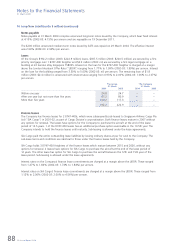
13 Share Capital (in $ million) (continued)
Share option plans (continued)
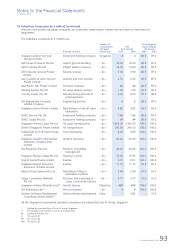
SIAEC ESOP
Exercisable period Exercise price Number outstanding Number exercisable
––––––––––––––––––––––––––––––––––––––––––––––––––––––––––––––––––––––––––––––––––––––––––––––––––––––––––––––––––––––––––––––––––––––––––––––––––––
28.3.2001 – 27.3.2010 $2.05 322,012 322,012
28.3.2002 – 27.3.2010 $2.05 13,477,913 13,477,913
28.3.2003 – 27.3.2010 $2.05 322,012 322,012
28.3.2004 – 27.3.2010 $2.05 322,013 322,013
3.7.2001 – 2.7.2010 $1.95 561,886 561,886
3.7.2002 – 2.7.2010 $1.95 11,773,388 11,773,388
3.7.2003 – 2.7.2010 $1.95 561,886 561,886
3.7.2004 – 2.7.2010 $1.95 561,890 –
2.7.2002 – 1.7.2011 $1.41 739,100 739,100
2.7.2003 – 1.7.2011 $1.41 8,852,900 8,852,900
2.7.2004 – 1.7.2011 $1.41 772,550 –
2.7.2005 – 1.7.2011 $1.41 772,550 –
1.7.2003 – 30.6.2012 $2.38 1,304,125 1,304,125
1.7.2004 – 30.6.2012 $2.38 13,171,725 –
1.7.2005 – 30.6.2012 $2.38 846,925 –
1.7.2006 – 30.6.2012 $2.38 846,925 –
1.7.2004 – 30.6.2013 $1.75 342,325 15,200
1.7.2005 – 30.6.2013 $1.75 6,430,725 –
1.7.2006 – 30.6.2013 $1.75 327,125 –
1.7.2007 – 30.6.2013 $1.75 327,125 –
––––––––––––––––––––––––––––––––––––––––––––––
Total number of options outstanding 62,637,100 @ 38,252,435
––––––––––––––––––––––––––––––––––––––––––––––
@ The total number of options outstanding includes:
(a) 5,098,400 share options not exercised by employees who have retired or ceased to be employed by SIA Engineering
Company Limited or any of its subsidiary companies by reason of (i) ill health, injury or disability or death; (ii)
redundancy; or (iii) any other reason approved in writing by the Compensation and HR Committee. The said options
are exercisable up to the expiration of the applicable exercise period or the period of 5 years from the date of
retirement or cessation of employment, whichever is earlier; and
(b) 547,600 share options not exercised by employees who have completed their fixed term contracts during the
financial year. The said options, if unvested, shall immediately vest and be exercisable from the date of cessation of
employment to the date falling 1 year from the date of cessation of employment.
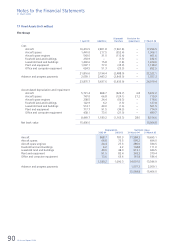
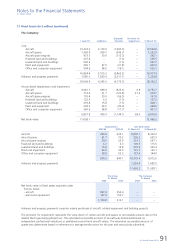
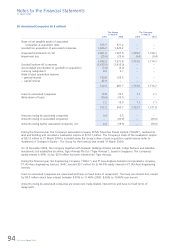
14 Deferred Account (in $ million)
The Group The Company
31 March 31 March
2004 2003 2004 2003
––––––––––––––––––––––––––––––––––––––––––––––––––––––––––––––––––––––––––––––––––––––––––––––––––––––––––––––––––––––––––––––––––––––––––––––––––––
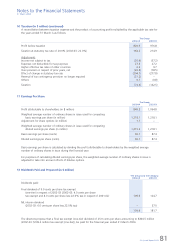
Deferred gain on sale and leaseback transactions
– operating leases 391.3 463.7 391.2 462.7
– finance leases 55.4 59.4 – –
––––––––––––––––––––––––––––––––––––––––––––––––––––––––––––––––––––
446.7 523.1 391.2 462.7
––––––––––––––––––––––––––––––––––––––––––––––––––––––––––––––––––––