Singapore Airlines 2004 Annual Report Download - page 51
Download and view the complete annual report
Please find page 51 of the 2004 Singapore Airlines annual report below. You can navigate through the pages in the report by either clicking on the pages listed below, or by using the keyword search tool below to find specific information within the annual report.-
 1
1 -
2
-
3
-
4
-
5
-
6
-
7
-
8
-
9
-
10
-
11
-
12
-
13
-
14
-
15
-
16
-
17
-
18
-
19
-
20
-
21
-
22
-
23
-
24
-
25
-
26
-
27
-
28
-
29
-
30
-
31
-
32
-
33
-
34
-
35
-
36
-
37
-
38
-
39
-
40
-
 41
41 -
 42
42 -
 43
43 -
 44
44 -
 45
45 -
 46
46 -
 47
47 -
 48
48 -
 49
49 -
 50
50 -
 51
51 -
 52
52 -
 53
53 -
 54
54 -
 55
55 -
 56
56 -
 57
57 -
 58
58 -
 59
59 -
 60
60 -
 61
61 -
62
-
63
-
64
-
65
-
66
-
67
-
68
-
69
-
70
-
71
-
72
-
73
-
74
-
75
-
76
-
77
-
78
-
79
-
80
-
81
-
82
-
83
-
84
-
85
-
86
-
87
-
88
-
89
-
90
-
91
-
92
-
93
-
94
-
95
-
96
-
97
-
98
-
99
-
100
-
101
-
102
-
103
-
104
-
105
-
106
-
107
-
108
-
109
-
110
-
111
-
112
-
113
-
114
-
115
-
116
-
117
-
118
-
119
-
120
-
121
-
122
-
123
-
124
-
125
-
126
-
127
-
128
-
129
-
130
-
131
-
132
 |
 |

49
SIA Annual Report 03/04
Financial Review
7,000
6,000
5,000
4,000
3,000
2,000
1,000
0
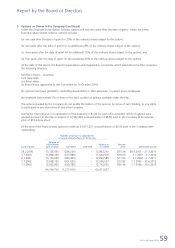
Passenger Revenue
$ Million
$ Million
1999-00 2000-01 2001-02 2002-03 2003-04
7,000
6,000
5,000
4,000
3,000
2,000
1,000
0
Performance of the Company (continued)
Revenue
The Company’s revenue decreased 10.7 per cent to $7,188 million as follows:
2003-04 2002-03
$ million $ million % Change
–––––––––––––––––––––––––––––––––––––––––––––––––––––––––––––––––––––––––––––––––––––––––––––––––––––––––––––––––––––––––––––––––––––––––––––––––––––––––
Passenger revenue 5,988.0 6,742.9 – 11.2
Excess baggage revenue 21.5 25.9 – 17.0
Non-scheduled services 12.0 15.6 – 23.1
Bellyhold revenue from SIA Cargo 750.8 815.4 – 7.9
–––––––––––––––––––––––––––––––––––––––––––––––––––
Direct operating revenue 6,772.3 7,599.8 – 10.9
Indirect operating revenue 415.3 447.2 – 7.1
–––––––––––––––––––––––––––––––––––––––––––––––––––
Total operating revenue 7,187.6 8,047.0 – 10.7
–––––––––––––––––––––––––––––––––––––––––––––––––––––––––––––––––––––––––––––––––––––––––––––––––––––––––––––––––––––––––––––––––––––––––––––––––––––––––
The decrease in passenger revenue was the result of:
$ million $ million
–––––––––––––––––––––––––––––––––––––––––––––––––––––––––––––––––––––––––––––––––––––––––––––––––––––––––––––––––––––––––––––––––––––––––––––––––––––––––
12.8% reduction in traffic:
11.4% decrease in seat capacity – 768.7
1.2% points decrease in passenger load factor – 96.2 – 864.9
––––––––––––––––
1.1% improvement in yield:
Weaker Singapore dollar (SGD) + 284.0
Change in passenger mix + 62.2
Lower local currency yields – 264.4 + 81.8
––––––––––––––––
Write-back of provision for KrisFlyer miles + 28.2
––––––––––––––––
Decrease in revenue – 754.9
–––––––––––––––––––––––––––––––––––––––––––––––––––––––––––––––––––––––––––––––––––––––––––––––––––––––––––––––––––––––––––––––––––––––––––––––––––––––––
SIA’s bellyhold revenue fell 7.9 per cent to $751 million due to lower net bellyhold capacity (–8.0%) because of reduced
passenger operations.
Indirect operating revenue decreased 7.1 per cent to $415 million. This was mainly due to lower collection of insurance and
security charges resulting from fewer passengers carried, and lower pool revenue from SIA Cargo because of reduced
bellyhold capacity (Bellyhold cargo revenue and excess baggage revenue are pooled and shared, with SIA taking 10 per cent
and SIA Cargo 90 per cent in accordance with the agreement between the two companies).
The sensitivity of passenger revenue to a one percentage point change in passenger load factor and a one per cent change
in passenger yield is as follows:
$ million
–––––––––––––––––––––––––––––––––––––––––––––––––––––––––––––––––––––––––––––––––––––––––––––––––––––––––––––––––––––––––––––––––––––––––––––––––––––––––
1.0% point change in passenger load factor, if yield and seat capacity remain constant 82
1.0% change in passenger yield, if passenger traffic remains constant 60
–––––––––––––––––––––––––––––––––––––––––––––––––––––––––––––––––––––––––––––––––––––––––––––––––––––––––––––––––––––––––––––––––––––––––––––––––––––––––