Singapore Airlines 2004 Annual Report Download - page 49
Download and view the complete annual report
Please find page 49 of the 2004 Singapore Airlines annual report below. You can navigate through the pages in the report by either clicking on the pages listed below, or by using the keyword search tool below to find specific information within the annual report.-
 1
1 -
2
-
3
-
4
-
5
-
6
-
7
-
8
-
9
-
10
-
11
-
12
-
13
-
14
-
15
-
16
-
17
-
18
-
19
-
20
-
21
-
22
-
23
-
24
-
25
-
26
-
27
-
28
-
29
-
30
-
31
-
32
-
33
-
34
-
35
-
36
-
37
-
38
-
 39
39 -
 40
40 -
 41
41 -
 42
42 -
 43
43 -
 44
44 -
 45
45 -
 46
46 -
 47
47 -
 48
48 -
 49
49 -
 50
50 -
 51
51 -
 52
52 -
 53
53 -
 54
54 -
 55
55 -
 56
56 -
 57
57 -
 58
58 -
 59
59 -
60
-
61
-
62
-
63
-
64
-
65
-
66
-
67
-
68
-
69
-
70
-
71
-
72
-
73
-
74
-
75
-
76
-
77
-
78
-
79
-
80
-
81
-
82
-
83
-
84
-
85
-
86
-
87
-
88
-
89
-
90
-
91
-
92
-
93
-
94
-
95
-
96
-
97
-
98
-
99
-
100
-
101
-
102
-
103
-
104
-
105
-
106
-
107
-
108
-
109
-
110
-
111
-
112
-
113
-
114
-
115
-
116
-
117
-
118
-
119
-
120
-
121
-
122
-
123
-
124
-
125
-
126
-
127
-
128
-
129
-
130
-
131
-
132
 |
 |

47
SIA Annual Report 03/04
Financial Review
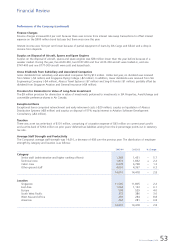
Performance of the Company
Operating Performance
2003-04 2002-03 % Change
––––––––––––––––––––––––––––––––––––––––––––––––––––––––––––––––––––––––––––––––––––––––––––––––––––––––––––––––––––––––––––––––––––––––––––––––––––––––
Passengers carried (thousand) 13,278 15,326 – 13.4
Available seat-km (million) 88,252.7 99,565.9 – 11.4
Revenue passenger-km (million) 64,685.2 74,183.2 – 12.8
Passenger load factor (%) 73.3 74.5 – 1.2 points
Passenger yield (cents/pkm) 9.2 9.1 + 1.1
Passenger unit cost (cents/ask) 6.7 6.7 –
Passenger breakeven load factor (%) 72.8 73.6 – 0.8 point
––––––––––––––––––––––––––––––––––––––––––––––––––––––––––––––––––––––––––––––––––––––––––––––––––––––––––––––––––––––––––––––––––––––––––––––––––––––––
The improvement in passenger yield was due mainly to a weaker Singapore dollar (SGD) and improved passenger mix.
The spread between passenger load factor and breakeven load factor narrowed to 0.5 percentage point in 2003-04 from
0.9 percentage point the year before.
A review of the Company’s operating performance by route region is as follows:
By Route Region R1 (2003-04 against 2002-03)
Passengers carried Passenger KM Available Seat KM
Change (thousands) % Change % Change
––––––––––––––––––––––––––––––––––––––––––––––––––––––––––––––––––––––––––––––––––––––––––––––––––––––––––––––––––––––––––––––––––––––––––––––––––––––––
East Asia – 1,356 – 19.5 – 18.0
Americas – 299 – 17.2 – 18.9
Europe – 225 – 11.1 – 7.7
South West Pacific – 144 – 4.4 + 0.1
West Asia and Africa – 24 – 6.2 – 3.4
––––––––––––––––––––––––––––––––––––––––––––––––––––––––––––––––––––
Systemwide – 2,048 – 12.8 – 11.4
–––––––––––––––––––––––––––––––––––––––––––––––––––––––––––––––––––––––––––––––––––––––––––––––––––––––––––––––––––––––––––––––––––––––––––––––––––––––––
R1 Each route region comprises routes originating from Singapore to final destinations in countries within the region concerned and vice versa. For example,
Singapore-Hong Kong–San Francisco-Hong Kong-Singapore route is classified under Americas region. East Asia covers Brunei, Hong Kong SAR, Indonesia,
Japan, South Korea, Malaysia, People’s Republic of China, Philippines, Thailand, Taiwan and Vietnam. Americas comprises Canada and USA. Europe
consists of Denmark, England, France, Germany, Greece, Italy, Spain, Switzerland, Belgium (ceased operation from 31 March 2003) and The Netherlands.
South West Pacific covers Australia and New Zealand. West Asia and Africa are made up of Bangladesh, India, Maldives, Saudi Arabia, South Africa,
Sri Lanka, Turkey, United Arab Emirates, Pakistan (ceased operation from 18 May 2002), Nepal (ceased operation from 1 June 2002), Egypt and Mauritius
(ceased operation from 13 April 2003).
80
60
40
20
0
Available Seat Capacity,
Passenger Traffic and Load Factor
Percent
Million
1999-00 2000-01 2001-02 2002-03 2003-04
Passenger Load Factor (%)
Available Seat-km
Revenue Passenger-km
120,000
90,000
60,000
30,000
0