Singapore Airlines 2004 Annual Report Download - page 112
Download and view the complete annual report
Please find page 112 of the 2004 Singapore Airlines annual report below. You can navigate through the pages in the report by either clicking on the pages listed below, or by using the keyword search tool below to find specific information within the annual report.-
 1
1 -
2
-
3
-
4
-
5
-
6
-
7
-
8
-
9
-
10
-
11
-
12
-
13
-
14
-
15
-
16
-
17
-
18
-
19
-
20
-
21
-
22
-
23
-
24
-
25
-
26
-
27
-
28
-
29
-
30
-
31
-
32
-
33
-
34
-
35
-
36
-
37
-
38
-
39
-
40
-
41
-
42
-
43
-
44
-
45
-
46
-
47
-
48
-
49
-
50
-
51
-
52
-
53
-
54
-
55
-
56
-
57
-
58
-
59
-
60
-
61
-
62
-
63
-
64
-
65
-
66
-
67
-
68
-
69
-
70
-
71
-
72
-
73
-
74
-
75
-
76
-
77
-
78
-
79
-
80
-
81
-
82
-
83
-
84
-
85
-
86
-
87
-
88
-
89
-
90
-
91
-
92
-
93
-
94
-
95
-
96
-
97
-
98
-
99
-
100
-
101
-
 102
102 -
 103
103 -
 104
104 -
 105
105 -
 106
106 -
 107
107 -
 108
108 -
 109
109 -
 110
110 -
 111
111 -
 112
112 -
 113
113 -
 114
114 -
 115
115 -
 116
116 -
 117
117 -
 118
118 -
 119
119 -
 120
120 -
 121
121 -
 122
122 -
123
-
124
-
125
-
126
-
127
-
128
-
129
-
130
-
131
-
132
 |
 |

110 SIA Annual Report 03/04
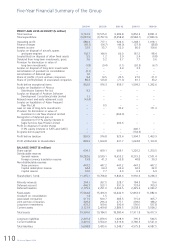
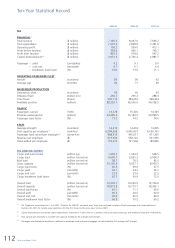
Five-Year Financial Summary of the Group
2003-04 2002-03 2001-02 2000-01 1999-00
–––––––––––––––––––––––––––––––––––––––––––––––––––––––––––––––––––––––––––––––––––––––––––––––––––––––––––––––––––––––––––––––––––––––––––––––––––––––––
PROFIT AND LOSS ACCOUNT ($ million)
Total revenue 9,761.9 10,515.0 9,382.8 9,852.2 8,861.4
Total expenditure (9,081.5) (9,797.9) (8,458.2) (8,584.1) (7,843.3)
––––––––––––––––––––––––––––––––––––––––––––––––––––––––––––––––––––––––––––––––––––––
Operating profit 680.4 717.1 924.6 1,268.1 1,018.1
Finance charges (65.1) (54.7) (44.0) (37.5) (28.8)
Interest income 32.5 33.7 52.0 86.0 154.6
Surplus on disposal of aircraft, spares
and spare engines 102.7 144.9 66.0 181.3 98.4
Surplus/(loss) on disposal of other fixed assets 5.5 1.2 2.9 2.4 (0.8)
Dividend from long-term investments, gross 3.6 5.2 5.7 7.7 3.6
Provision for diminution in value of
long-term investments (1.8) (9.4) (1.1) (20.5) (6.7)
Surplus on disposal of long-term investments – – 4.4 3.0 –
Amortization of goodwill on consolidation (0.1) ––––
Amortization of deferred gain 1.6––––
Share of profits of joint venture companies 6.4 14.5 20.5 27.0 21.0
Share of profits/(losses) of associated companies 86.3 123.8 (71.3) 81.7 33.2
––––––––––––––––––––––––––––––––––––––––––––––––––––––––––––––––––––––––––––––––––––––
Profit before exceptional items 852.0 976.3 959.7 1,599.2 1,292.6
Surplus on liquidation of Abacus
Distribution Systems Pte Ltd 9.2 ––––
Surplus on disposal of Aviation Software
Development Consultancy India Limited 1.1 ––––
Retrenchment and early retirement costs (41.4) ––––
Surplus on liquidation of Asian Frequent
Flyer Pte Ltd – 0.5 – – –
Gain on sale of long-term investments – – 30.2 – 171.3
Provision for diminution in value of
investment in Air New Zealand Limited – – (266.9) – –
Recognition of deferred gain on
divestment of 51% equity interests in
Eagle Services Asia Private Limited – – 202.6 – –
Profit on disposal of vendor shares
(13% equity interests in SATS and SIAEC) – – – 440.1 –
Ex-gratia bonus payment – – – (134.6) –
––––––––––––––––––––––––––––––––––––––––––––––––––––––––––––––––––––––––––––––––––––––
Profit before taxation 820.9 976.8 925.6 1,904.7 1,463.9
Profit attributable to shareholders 849.3 1,064.8 631.7 1,624.8 1,163.8
–––––––––––––––––––––––––––––––––––––––––––––––––––––––––––––––––––––––––––––––––––––––––––––––––––––––––––––––––––––––––––––––––––––––––––––––––––––––––
BALANCE SHEET ($ million)
Share capital 609.1 609.1 609.1 1,220.2 1,250.5
Distributable reserves
General reserve 10,282.6 9,539.1 8,655.2 8,215.2 7,501.4
Foreign currency translation reserve 19.8 41.3 63.8 40.8 30.3
Non-distributable reserves
Share premium 447.2 447.2 447.2 447.2 447.2
Capital redemption reserve 64.4 64.4 64.4 62.3 32.0
Capital reserve 32.0 7.7 6.9 6.9 6.9
––––––––––––––––––––––––––––––––––––––––––––––––––––––––––––––––––––––––––––––––––––––
Shareholders’ funds 11,455.1 10,708.8 9,846.6 9,992.6 9,268.3
–––––––––––––––––––––––––––––––––––––––––––––––––––––––––––––––––––––––––––––––––––––––––––––––––––––––––––––––––––––––––––––––––––––––––––––––––––––––––
Minority interests 304.1 267.5 228.7 184.5 19.6
Deferred account 446.7 523.1 591.9 733.4 709.3
Deferred taxation 2,175.3 2,251.0 2,664.5 2,425.6 2,333.2
Fixed assets 15,564.8 15,406.0 14,442.9 12,863.0 11,882.0
Goodwill on consolidation 1.4 1.5 – – –
Associated companies 517.5 500.7 385.5 715.4 305.7
Joint venture companies 309.2 296.4 277.1 239.0 188.2
Long-term investments 475.2 569.6 590.4 556.0 537.8
Current assets 3,121.9 2,409.8 2,884.5 3,538.5 3,504.2
––––––––––––––––––––––––––––––––––––––––––––––––––––––––––––––––––––––––––––––––––––––
Total assets 19,990.0 19,184.0 18,580.4 17,911.9 16,417.9
–––––––––––––––––––––––––––––––––––––––––––––––––––––––––––––––––––––––––––––––––––––––––––––––––––––––––––––––––––––––––––––––––––––––––––––––––––––––––
Long-term liabilities 2,207.2 1,879.6 1,928.9 795.5 566.5
Current liabilities 3,401.6 3,554.0 3,319.8 3,780.3 3,521.0
––––––––––––––––––––––––––––––––––––––––––––––––––––––––––––––––––––––––––––––––––––––
Total liabilities 5,608.8 5,433.6 5,248.7 4,575.8 4,087.5
–––––––––––––––––––––––––––––––––––––––––––––––––––––––––––––––––––––––––––––––––––––––––––––––––––––––––––––––––––––––––––––––––––––––––––––––––––––––––