Singapore Airlines 2004 Annual Report Download - page 50
Download and view the complete annual report
Please find page 50 of the 2004 Singapore Airlines annual report below. You can navigate through the pages in the report by either clicking on the pages listed below, or by using the keyword search tool below to find specific information within the annual report.-
 1
1 -
2
-
3
-
4
-
5
-
6
-
7
-
8
-
9
-
10
-
11
-
12
-
13
-
14
-
15
-
16
-
17
-
18
-
19
-
20
-
21
-
22
-
23
-
24
-
25
-
26
-
27
-
28
-
29
-
30
-
31
-
32
-
33
-
34
-
35
-
36
-
37
-
38
-
39
-
 40
40 -
 41
41 -
 42
42 -
 43
43 -
 44
44 -
 45
45 -
 46
46 -
 47
47 -
 48
48 -
 49
49 -
 50
50 -
 51
51 -
 52
52 -
 53
53 -
 54
54 -
 55
55 -
 56
56 -
 57
57 -
 58
58 -
 59
59 -
 60
60 -
61
-
62
-
63
-
64
-
65
-
66
-
67
-
68
-
69
-
70
-
71
-
72
-
73
-
74
-
75
-
76
-
77
-
78
-
79
-
80
-
81
-
82
-
83
-
84
-
85
-
86
-
87
-
88
-
89
-
90
-
91
-
92
-
93
-
94
-
95
-
96
-
97
-
98
-
99
-
100
-
101
-
102
-
103
-
104
-
105
-
106
-
107
-
108
-
109
-
110
-
111
-
112
-
113
-
114
-
115
-
116
-
117
-
118
-
119
-
120
-
121
-
122
-
123
-
124
-
125
-
126
-
127
-
128
-
129
-
130
-
131
-
132
 |
 |

48 SIA Annual Report 03/04
Financial Review
90
75
60
45
30
15
0
Passenger Load Factor by Route Region
Percent
Percent
East Americas Europe South West West Asia
Asia Pacific and Africa
2003-04
2002-03
90
75
60
45
30
15
0
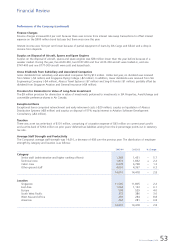
Performance of the Company (continued)
Operating Performance (continued)
Passenger Load Factor (%) Change
2003-04 2002-03 (% points)
–––––––––––––––––––––––––––––––––––––––––––––––––––––––––––––––––––––––––––––––––––––––––––––––––––––––––––––––––––––––––––––––––––––––––––––––––––––––––
East Asia 66.3 67.5 – 1.2
Americas 74.0 72.4 + 1.6
Europe 76.1 79.1 – 3.0
South West Pacific 78.0 81.7 – 3.7
West Asia and Africa 72.5 74.7 – 2.2
––––––––––––––––––––––––––––––––––––––––––––––––––––
Systemwide 73.3 74.5 – 1.2
–––––––––––––––––––––––––––––––––––––––––––––––––––––––––––––––––––––––––––––––––––––––––––––––––––––––––––––––––––––––––––––––––––––––––––––––––––––––––
Earnings
2003-04 2002-03
$ million $ million % Change
–––––––––––––––––––––––––––––––––––––––––––––––––––––––––––––––––––––––––––––––––––––––––––––––––––––––––––––––––––––––––––––––––––––––––––––––––––––––––
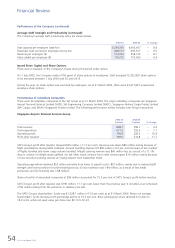
Revenue 7,187.6 8,047.0 – 10.7
Expenditure (7,037.4) (7,838.0) – 10.2
–––––––––––––––––––––––––––––––––––––––––––––––––––
Operating Profit 150.2 209.0 – 28.1
Finance charges (56.4) (52.1) + 8.3
Interest income 33.1 38.5 – 14.0
Surplus on disposal of aircraft, spares and spare engines 100.1 138.3 – 27.6
Surplus/(loss) on disposal of other fixed assets 4.7 (0.8) n.m.
Dividends from subsidiary and associated companies, gross 118.9 131.5 – 9.6
Dividends from long-term investments, gross 2.5 4.1 – 39.0
Provision for diminution in value of investments (8.5) (9.4) – 9.6
–––––––––––––––––––––––––––––––––––––––––––––––––––
Profit before exceptional items 344.6 459.1 – 24.9
Exceptional items (16.2) 1.0 n.m.
–––––––––––––––––––––––––––––––––––––––––––––––––––
Profit before taxation 328.4 460.1 – 28.6
Taxation expense (63.5) (67.2) – 5.5
Adjustment for reduction in Singapore statutory tax rate 164.4 225.1 – 27.0
–––––––––––––––––––––––––––––––––––––––––––––––––––
Profit after taxation 429.3 618.0 – 30.5
–––––––––––––––––––––––––––––––––––––––––––––––––––––––––––––––––––––––––––––––––––––––––––––––––––––––––––––––––––––––––––––––––––––––––––––––––––––––––
n.m. not meaningful