Singapore Airlines 2004 Annual Report Download - page 54
Download and view the complete annual report
Please find page 54 of the 2004 Singapore Airlines annual report below. You can navigate through the pages in the report by either clicking on the pages listed below, or by using the keyword search tool below to find specific information within the annual report.-
 1
1 -
2
-
3
-
4
-
5
-
6
-
7
-
8
-
9
-
10
-
11
-
12
-
13
-
14
-
15
-
16
-
17
-
18
-
19
-
20
-
21
-
22
-
23
-
24
-
25
-
26
-
27
-
28
-
29
-
30
-
31
-
32
-
33
-
34
-
35
-
36
-
37
-
38
-
39
-
40
-
41
-
42
-
43
-
 44
44 -
 45
45 -
 46
46 -
 47
47 -
 48
48 -
 49
49 -
 50
50 -
 51
51 -
 52
52 -
 53
53 -
 54
54 -
 55
55 -
 56
56 -
 57
57 -
 58
58 -
 59
59 -
 60
60 -
 61
61 -
 62
62 -
 63
63 -
 64
64 -
65
-
66
-
67
-
68
-
69
-
70
-
71
-
72
-
73
-
74
-
75
-
76
-
77
-
78
-
79
-
80
-
81
-
82
-
83
-
84
-
85
-
86
-
87
-
88
-
89
-
90
-
91
-
92
-
93
-
94
-
95
-
96
-
97
-
98
-
99
-
100
-
101
-
102
-
103
-
104
-
105
-
106
-
107
-
108
-
109
-
110
-
111
-
112
-
113
-
114
-
115
-
116
-
117
-
118
-
119
-
120
-
121
-
122
-
123
-
124
-
125
-
126
-
127
-
128
-
129
-
130
-
131
-
132
 |
 |

52 SIA Annual Report 03/04
Performance of the Company (continued)
Expenditure (continued)
Handling costs, at $628 million, was 12.7 per cent less than last year due to a reduction in the number of flights operated.
Sales costs decreased $145 million mainly as a consequence of SARS, which resulted in (i) many agents failing to achieve
their sales targets; (ii) lower computer reservation systems booking fees as fewer bookings were made; and (iii) suspension
of advertising and sales promotion activities during SARS outbreak.
Inflight meals and other passenger costs fell $69 million as a result of fewer passengers carried (–13.4 per cent).
Airport and overflying charges were $70 million lower compared to last year. The reduction came from a decrease in the
number of flights operated and discount on landing fees in Singapore.
Rentals on leased aircraft increased $8 million due to (i) additional sale and leaseback of one B747-400 and one B777-300
aircraft in 2003-04; (ii) full year’s impact of sale and leaseback of one B747-400 aircraft in 2002-03; and (iii) higher lease
rentals for four B747-400 aircraft as structured under the lease agreements. The increase was partially offset by (i) lower
lease rental for one B747-400 aircraft as structured under the lease agreement; and (ii) return of one B747-400 aircraft to
lessor. A weaker US dollar (USD) also cushioned the increase.
Communication and information technology costs fell by $26 million due to lower (i) software and equipment maintenance
cost; (ii) information technology professional and contract fees; (iii) volume of data transmission; and (iv) hire charges for
computer equipment.
Other costs decreased by $20 million. This was largely due to a decrease in comprehensive aviation insurance costs resulting
from lower premium charges for Hull War Risks policies, and lower liability cover for Aviation Third Party War Risks.
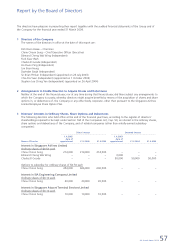
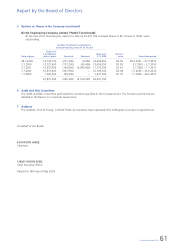
Fuel Productivity and Sensitivity Analysis
Fuel productivity as measured by load tonne-km per American gallon (ltk/AG) increased 1.8% over the previous year to
9.47 ltk/AG. This was attributable to a younger aircraft fleet, arising from the addition of new B777 and A340-500 aircraft,
and phase-out of the older A310-300 aircraft.
A change in fuel productivity (passenger aircraft) of 1.0 percent would impact the Company’s annual fuel costs by about
$14 million, before accounting for changes in fuel price, USD exchange rate and flying operations.
A change in price of one US cent per American gallon affects the Company’s annual fuel costs by about $16 million, before
accounting for USD exchange rate movements, and changes in volume of fuel consumed.
Financial Review
Fuel Productivity of Passenger Fleet
LTK/AG
LTK/AG
1999-00 2000-01 2001-02 2002-03 2003-04
10.0
9.5
9.0
8.5
8.0
10.0
9.5
9.0
8.5
8.0