Singapore Airlines 2004 Annual Report Download - page 101
Download and view the complete annual report
Please find page 101 of the 2004 Singapore Airlines annual report below. You can navigate through the pages in the report by either clicking on the pages listed below, or by using the keyword search tool below to find specific information within the annual report.-
 1
1 -
2
-
3
-
4
-
5
-
6
-
7
-
8
-
9
-
10
-
11
-
12
-
13
-
14
-
15
-
16
-
17
-
18
-
19
-
20
-
21
-
22
-
23
-
24
-
25
-
26
-
27
-
28
-
29
-
30
-
31
-
32
-
33
-
34
-
35
-
36
-
37
-
38
-
39
-
40
-
41
-
42
-
43
-
44
-
45
-
46
-
47
-
48
-
49
-
50
-
51
-
52
-
53
-
54
-
55
-
56
-
57
-
58
-
59
-
60
-
61
-
62
-
63
-
64
-
65
-
66
-
67
-
68
-
69
-
70
-
71
-
72
-
73
-
74
-
75
-
76
-
77
-
78
-
79
-
80
-
81
-
82
-
83
-
84
-
85
-
86
-
87
-
88
-
89
-
90
-
 91
91 -
 92
92 -
 93
93 -
 94
94 -
 95
95 -
 96
96 -
 97
97 -
 98
98 -
 99
99 -
 100
100 -
 101
101 -
 102
102 -
 103
103 -
 104
104 -
 105
105 -
 106
106 -
 107
107 -
 108
108 -
 109
109 -
 110
110 -
 111
111 -
112
-
113
-
114
-
115
-
116
-
117
-
118
-
119
-
120
-
121
-
122
-
123
-
124
-
125
-
126
-
127
-
128
-
129
-
130
-
131
-
132
 |
 |

99
SIA Annual Report 03/04
Notes to the Financial Statements
31 March 2004
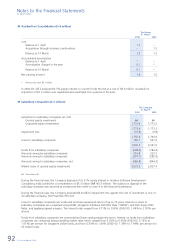
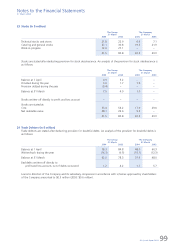
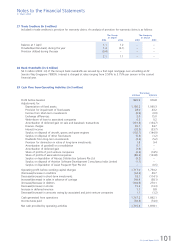
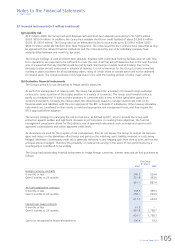
23 Stocks (in $ million)
The Group The Company
31 March 31 March
2004 2003 2004 2003
––––––––––––––––––––––––––––––––––––––––––––––––––––––––––––––––––––––––––––––––––––––––––––––––––––––––––––––––––––––––––––––––––––––––––––––––––––
Technical stocks and stores 21.8 22.9 6.9 7.1
Catering and general stocks 27.1 30.8 19.3 21.9
Work-in-progress 12.6 27.1 – –
––––––––––––––––––––––––––––––––––––––––––––––––––––––––––––––––––––
61.5 80.8 26.2 29.0
––––––––––––––––––––––––––––––––––––––––––––––––––––––––––––––––––––
Stocks are stated after deducting provision for stock obsolescence. An analysis of the provision for stock obsolescence is
as follows:
The Group The Company
31 March 31 March
2004 2003 2004 2003
––––––––––––––––––––––––––––––––––––––––––––––––––––––––––––––––––––––––––––––––––––––––––––––––––––––––––––––––––––––––––––––––––––––––––––––––––––
Balance at 1 April 4.9 3.2 – –
Provided during the year 3.0 1.7 1.0 –
Provision utilized during the year (0.4) – – –
––––––––––––––––––––––––––––––––––––––––––––––––––––––––––––––––––––
Balance at 31 March 7.5 4.9 1.0 –
––––––––––––––––––––––––––––––––––––––––––––––––––––––––––––––––––––
Stocks written-off directly to profit and loss account ––––
––––––––––––––––––––––––––––––––––––––––––––––––––––––––––––––––––––
Stocks are stated at:
Cost 33.4 58.2 17.0 29.0
Net realizable value 28.1 22.6 9.2 –
––––––––––––––––––––––––––––––––––––––––––––––––––––––––––––––––––––
61.5 80.8 26.2 29.0
––––––––––––––––––––––––––––––––––––––––––––––––––––––––––––––––––––
24 Trade Debtors (in $ million)
Trade debtors are stated after deducting provision for doubtful debts. An analysis of the provision for doubtful debts is
as follows:
The Group The Company
31 March 31 March
2004 2003 2004 2003
––––––––––––––––––––––––––––––––––––––––––––––––––––––––––––––––––––––––––––––––––––––––––––––––––––––––––––––––––––––––––––––––––––––––––––––––––––
Balance at 1 April 78.3 84.8 48.0 60.3
Written-back during the year (16.3) (6.5) (10.1) (12.3)
––––––––––––––––––––––––––––––––––––––––––––––––––––––––––––––––––––
Balance at 31 March 62.0 78.3 37.9 48.0
––––––––––––––––––––––––––––––––––––––––––––––––––––––––––––––––––––
Bad debts written-off directly to
profit and loss account, net of debts recovered 1.2 4.2 1.7 5.7
––––––––––––––––––––––––––––––––––––––––––––––––––––––––––––––––––––
Loans to directors of the Company and its subsidiary companies in accordance with schemes approved by shareholders
of the Company amounted to $0.3 million (2003: $0.6 million).