Rite Aid 2011 Annual Report Download - page 83
Download and view the complete annual report
Please find page 83 of the 2011 Rite Aid annual report below. You can navigate through the pages in the report by either clicking on the pages listed below, or by using the keyword search tool below to find specific information within the annual report.
RITE AID CORPORATION AND SUBSIDIARIES
NOTES TO CONSOLIDATED FINANCIAL STATEMENTS (Continued)
For the Years Ended February 26, 2011, February 27, 2010 and February 28, 2009
(In thousands, except per share amounts)
8. Goodwill and Other Intangibles Assets
At February 28, 2009, the Company impaired all of its existing goodwill, which resulted in a
non-cash charge of $1,810,223. This entry was required due to the fact that the Company’s market
value, as indicated by the trading price of its common stock, was less than the carrying value of its net
assets as of February 28, 2009.
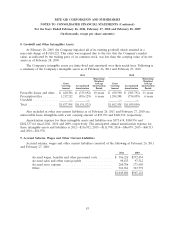
The Company’s intangible assets are finite-lived and amortized over their useful lives. Following is
a summary of the Company’s intangible assets as of February 26, 2011 and February 27, 2010.
2011 2010
Remaining Remaining
Weighted Weighted
Gross Average Gross Average
Carrying Accumulated Amortization Carrying Accumulated Amortization
Amount Amortization Period Amount Amortization Period
Favorable leases and other . $ 620,786 $ (335,692) 10 years $ 658,590 $ (305,791) 11 years
Prescription files ........ 1,217,212 (856,129) 6 years 1,204,348 (734,059) 6 years
Goodwill .............. — — — —
Total ................. $1,837,998 $(1,191,821) $1,862,938 $(1,039,850)
Also included in other non-current liabilities as of February 26, 2011 and February 27, 2010 are
unfavorable lease intangibles with a net carrying amount of $93,952 and $106,910, respectively.
Amortization expense for these intangible assets and liabilities was $173,618, $184,956 and
$202,537 for fiscal 2011, 2010 and 2009, respectively. The anticipated annual amortization expense for
these intangible assets and liabilities is 2012—$136,932; 2013—$111,798; 2014—$86,079; 2015—$68,715
and 2016—$56,970.
9. Accrued Salaries, Wages and Other Current Liabilities
Accrued salaries, wages and other current liabilities consisted of the following at February 26, 2011
and February 27, 2010:
2011 2010
Accrued wages, benefits and other personnel costs ........ $ 386,226 $372,434
Accrued sales and other taxes payable ................. 98,433 97,512
Accrued store expense ............................ 200,786 171,403
Other ........................................ 363,961 323,772
$1,049,406 $965,121
83


