Rite Aid 2011 Annual Report Download - page 30
Download and view the complete annual report
Please find page 30 of the 2011 Rite Aid annual report below. You can navigate through the pages in the report by either clicking on the pages listed below, or by using the keyword search tool below to find specific information within the annual report.
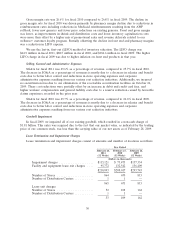
Gross margin rate was 26.6% for fiscal 2010 compared to 26.8% in fiscal 2009. The decline in
gross margin rate for fiscal 2010 was driven primarily by pharmacy margin decline due to reductions in
reimbursement rates including reductions in Medicaid reimbursements resulting from the AWP
rollback, fewer new generics and fewer price reductions on existing generics. Front end gross margin
was lower, as improvements in shrink and distribution costs and lower inventory capitalization costs
were more than offset by a higher mix of promotional sales and revenue deferrals related to our
wellness+ customer loyalty program. Partially offsetting the decline in front end and pharmacy margins
was a reduction in LIFO expense.
We use the last-in, first-out (LIFO) method of inventory valuation. The LIFO charge was
$44.9 million in fiscal 2011, $88.5 million in fiscal 2010, and $184.6 million in fiscal 2009. The higher
LIFO charge in fiscal 2009 was due to higher inflation on front end products in that year.
Selling, General and Administrative Expenses
SG&A for fiscal 2011 was 25.6% as a percentage of revenue, compared to 25.7% in fiscal 2010.
The decrease in SG&A as a percentage of revenues is mostly due to a decrease in salaries and benefit
costs due to better labor control and reductions in store operating expenses and corporate
administrative expenses resulting from our various cost reduction initiatives. Additionally, we incurred
no securitization fees due to our elimination of the receivables securitization facilities on October 26,
2009. These cost reductions were partially offset by an increase in debit and credit card fees, and
higher workers’ compensation and general liability costs due to a reserve reduction caused by favorable
claims experience recorded in the prior year.
SG&A for fiscal 2010 was 25.7% as a percentage of revenue, compared to 26.6% in fiscal 2009.
The decrease in SG&A as a percentage of revenues is mostly due to a decrease in salaries and benefit
costs due to better labor control and reductions in store operating expenses and corporate
administrative expenses resulting from our various cost reduction initiatives.
Goodwill Impairment
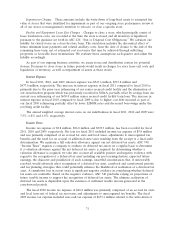
In fiscal 2009, we impaired all of our existing goodwill, which resulted in a non-cash charge of
$1.81 billion. This entry was required due to the fact that our market value, as indicated by the trading
price of our common stock, was less than the carrying value of our net assets as of February 28, 2009.
Lease Termination and Impairment Charges
Lease termination and impairment charges consist of amounts and number of locations as follows:
Year Ended
February 26, February 27, February 28,
2011 2010 2009
(52 Weeks) (52 Weeks) (52 Weeks)
(Dollars in thousands)
Impairment charges .................... $115,121 $ 75,475 $157,334
Facility and equipment lease exit charges .... 95,772 132,542 136,409
$210,893 $208,017 $293,743
Number of Stores ..................... 864 670 815
Number of Distribution Centers ........... 1 1 —
865 671 815
Lease exit charges
Number of Stores ..................... 52 108 162
Number of Distribution Centers ........... 1 1 —
53 109 162
30


