Rite Aid 2011 Annual Report Download - page 82
Download and view the complete annual report
Please find page 82 of the 2011 Rite Aid annual report below. You can navigate through the pages in the report by either clicking on the pages listed below, or by using the keyword search tool below to find specific information within the annual report.-
 1
1 -
2
-
3
-
4
-
5
-
6
-
7
-
8
-
9
-
10
-
11
-
12
-
13
-
14
-
15
-
16
-
17
-
18
-
19
-
20
-
21
-
22
-
23
-
24
-
25
-
26
-
27
-
28
-
29
-
30
-
31
-
32
-
33
-
34
-
35
-
36
-
37
-
38
-
39
-
40
-
41
-
42
-
43
-
44
-
45
-
46
-
47
-
48
-
49
-
50
-
51
-
52
-
53
-
54
-
55
-
56
-
57
-
58
-
59
-
60
-
61
-
62
-
63
-
64
-
65
-
66
-
67
-
68
-
69
-
70
-
71
-
 72
72 -
 73
73 -
 74
74 -
 75
75 -
 76
76 -
 77
77 -
 78
78 -
 79
79 -
 80
80 -
 81
81 -
 82
82 -
 83
83 -
 84
84 -
 85
85 -
 86
86 -
 87
87 -
 88
88 -
 89
89 -
 90
90 -
 91
91 -
 92
92 -
93
-
94
-
95
-
96
-
97
-
98
-
99
-
100
-
101
-
102
-
103
-
104
-
105
-
106
-
107
-
108
-
109
-
110
-
111
-
112
-
113
-
114
-
115
-
116
-
117
-
118
-
119
 |
 |

RITE AID CORPORATION AND SUBSIDIARIES
NOTES TO CONSOLIDATED FINANCIAL STATEMENTS (Continued)
For the Years Ended February 26, 2011, February 27, 2010 and February 28, 2009
(In thousands, except per share amounts)
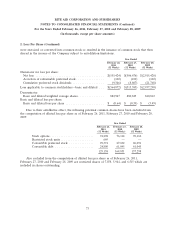
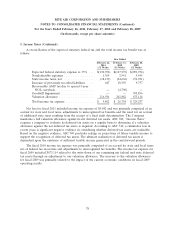
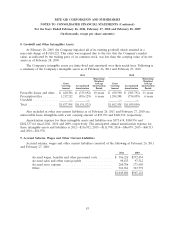
6. Accounts Receivable (Continued)
receivables securitization activity is reflected through October 26, 2009, the date of the termination of
the securitization facilities.
Year Ended
February 26, February 27, February 28,
2011 2010 2009
(52 Weeks) (52 Weeks) (52 Weeks)
Average amount of outstanding receivables
transferred .......................... $— $ 226,521 $ 471,319
Total receivable transfers ................. $— $2,240,000 $6,940,000
Collections made by the Company as part of the
servicing arrangement on behalf of the CPVs . $— $2,320,000 $7,045,000
The program fee under the First Lien Facility was LIBOR plus 2.0% of the total amount advanced
under the facility. The liquidity fee was 3.5% of the total facility commitment of $345,000. The program
and the liquidity fees were recorded as a component of selling, general and administrative expenses.
Program and liquidity fees for fiscal 2010 and 2009 were $11,980 and $24,903, respectively. There were
no program and liquidity fees for fiscal 2011.
Financing fees related to the Second Lien Facility for fiscal 2010 and 2009 were $24,882 and
$1,161, respectively and were recorded as a component of selling, general, and administrative expenses.
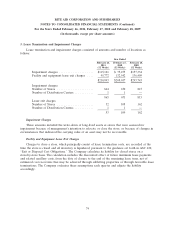
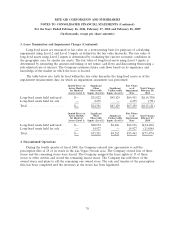
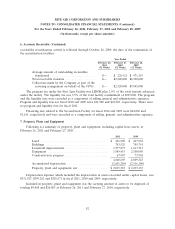
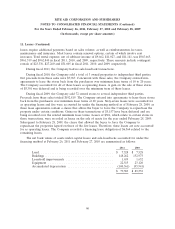
7. Property, Plant and Equipment
Following is a summary of property, plant and equipment, including capital lease assets, at
February 26, 2011 and February 27, 2010:
2011 2010
Land ...................................... $ 261,909 $ 267,938
Buildings ................................... 743,525 749,741
Leasehold improvements ........................ 1,577,873 1,617,713
Equipment .................................. 1,989,415 2,100,050
Construction in progress ........................ 67,947 73,901
4,640,669 4,809,343
Accumulated depreciation ....................... (2,601,286) (2,516,190)
Property, plant and equipment, net ................. $2,039,383 $ 2,293,153
Depreciation expense, which included the depreciation of assets recorded under capital leases, was
$331,927, $349,282 and $383,671 in fiscal 2011, 2010 and 2009, respectively.
Included in property, plant and equipment was the carrying amount of assets to be disposed of
totaling $4,608 and $26,003 at February 26, 2011 and February 27, 2010, respectively.
82