Rite Aid 2011 Annual Report Download - page 25
Download and view the complete annual report
Please find page 25 of the 2011 Rite Aid annual report below. You can navigate through the pages in the report by either clicking on the pages listed below, or by using the keyword search tool below to find specific information within the annual report.-
 1
1 -
2
-
3
-
4
-
5
-
6
-
7
-
8
-
9
-
10
-
11
-
12
-
13
-
14
-
 15
15 -
 16
16 -
 17
17 -
 18
18 -
 19
19 -
 20
20 -
 21
21 -
 22
22 -
 23
23 -
 24
24 -
 25
25 -
 26
26 -
 27
27 -
 28
28 -
 29
29 -
 30
30 -
 31
31 -
 32
32 -
 33
33 -
 34
34 -
 35
35 -
36
-
37
-
38
-
39
-
40
-
41
-
42
-
43
-
44
-
45
-
46
-
47
-
48
-
49
-
50
-
51
-
52
-
53
-
54
-
55
-
56
-
57
-
58
-
59
-
60
-
61
-
62
-
63
-
64
-
65
-
66
-
67
-
68
-
69
-
70
-
71
-
72
-
73
-
74
-
75
-
76
-
77
-
78
-
79
-
80
-
81
-
82
-
83
-
84
-
85
-
86
-
87
-
88
-
89
-
90
-
91
-
92
-
93
-
94
-
95
-
96
-
97
-
98
-
99
-
100
-
101
-
102
-
103
-
104
-
105
-
106
-
107
-
108
-
109
-
110
-
111
-
112
-
113
-
114
-
115
-
116
-
117
-
118
-
119
 |
 |

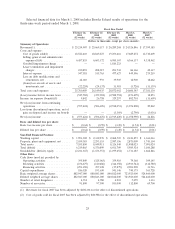
Selected financial data for March 1, 2008 includes Brooks Eckerd results of operations for the
thirty-nine week period ended March 1, 2008.
Fiscal Year Ended
February 26, February 27, February 28, March 1, March 3,
2011 2010 2009 2008 2007
(52 weeks) (52 weeks) (52 weeks) (52 weeks) (52 weeks)
(Dollars in thousands, except per share amounts)
Summary of Operations:
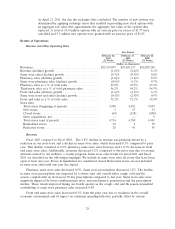
Revenues(1) ..................... $25,214,907 $ 25,669,117 $ 26,289,268 $ 24,326,846 $ 17,399,383
Costs and expense:
Cost of goods sold(2) ............. 18,522,403 18,845,027 19,253,616 17,689,272 12,710,609
Selling, general and administrative
expenses(3)(4) ................ 6,457,833 6,603,372 6,985,367 6,366,137 4,338,462
Goodwill impairment charge ........ — — 1,810,223 — —
Lease termination and impairment
charges ..................... 210,893 208,017 293,743 86,166 49,317
Interest expense ................ 547,581 515,763 477,627 449,596 275,219
Loss on debt modifications and
retirements, net ............... 44,003 993 39,905 12,900 18,662
(Gain) loss on sale of assets and
investments, net ............... (22,224) (24,137) 11,581 (3,726) (11,139)
Total costs and expenses ............ 25,760,489 26,149,035 28,872,062 24,600,345 17,381,130
(Loss) income before income taxes ..... (545,582) (479,918) (2,582,794) (273,499) 18,253
Income tax expense (benefit)(5) ....... 9,842 26,758 329,257 802,701 (11,609)
Net (loss) income from continuing
operations .................... (555,424) (506,676) (2,912,051) (1,076,200) 29,862
Loss from discontinued operations, net of
gain on disposal and income tax benefit — — (3,369) (2,790) (3,036)
Net (loss) income ................. $ (555,424) $ (506,676) $ (2,915,420) $ (1,078,990) $ 26,826
Basic and diluted loss per share:
Basic loss income per share .......... $ (0.64) $ (0.59) $ (3.49) $ (1.54) $ (0.01)
Diluted loss per share .............. $ (0.64) $ (0.59) $ (3.49) $ (1.54) $ (0.01)
Year-End Financial Position:
Working capital .................. $ 1,991,042 $ 2,332,976 $ 2,062,505 $ 2,123,855 $ 1,363,063
Property, plant and equipment, net ..... 2,039,383 2,293,153 2,587,356 2,873,009 1,743,104
Total assets ..................... 7,555,850 8,049,911 8,326,540 11,488,023 7,091,024
Total debt(6) .................... 6,219,865 6,370,899 6,011,709 5,985,524 3,100,288
Stockholders’ (deficit) equity ......... (2,211,367) (1,673,551) (1,199,652) 1,711,185 1,662,846
Other Data:
Cash flows (used in) provided by:
Operating activities .............. 395,849 (325,063) 359,910 79,368 309,145
Investing activities ............... (156,677) (120,486) (346,358) (2,933,744) (312,780)
Financing activities ............... (251,650) 397,108 (17,279) 2,903,990 33,716
Capital expenditures ............... 186,520 193,630 541,346 740,375 363,728
Basic weighted average shares ......... 882,947,000 880,843,000 840,812,000 723,923,000 524,460,000
Diluted weighted average shares ....... 882,947,000 880,843,000 840,812,000 723,923,000 524,460,000
Number of retail drugstores .......... 4,714 4,780 4,901 5,059 3,333
Number of associates ............... 91,800 97,500 103,000 112,800 69,700
(1) Revenues for fiscal 2007 has been adjusted by $108,336 for the effect of discontinued operations.
(2) Cost of goods sold for fiscal 2007 has been adjusted by $80,988 for the effect of discontinued operations.
25