Rite Aid 2011 Annual Report Download - page 61
Download and view the complete annual report
Please find page 61 of the 2011 Rite Aid annual report below. You can navigate through the pages in the report by either clicking on the pages listed below, or by using the keyword search tool below to find specific information within the annual report.-
 1
1 -
2
-
3
-
4
-
5
-
6
-
7
-
8
-
9
-
10
-
11
-
12
-
13
-
14
-
15
-
16
-
17
-
18
-
19
-
20
-
21
-
22
-
23
-
24
-
25
-
26
-
27
-
28
-
29
-
30
-
31
-
32
-
33
-
34
-
35
-
36
-
37
-
38
-
39
-
40
-
41
-
42
-
43
-
44
-
45
-
46
-
47
-
48
-
49
-
50
-
 51
51 -
 52
52 -
 53
53 -
 54
54 -
 55
55 -
 56
56 -
 57
57 -
 58
58 -
 59
59 -
 60
60 -
 61
61 -
 62
62 -
 63
63 -
 64
64 -
 65
65 -
 66
66 -
 67
67 -
 68
68 -
 69
69 -
 70
70 -
 71
71 -
72
-
73
-
74
-
75
-
76
-
77
-
78
-
79
-
80
-
81
-
82
-
83
-
84
-
85
-
86
-
87
-
88
-
89
-
90
-
91
-
92
-
93
-
94
-
95
-
96
-
97
-
98
-
99
-
100
-
101
-
102
-
103
-
104
-
105
-
106
-
107
-
108
-
109
-
110
-
111
-
112
-
113
-
114
-
115
-
116
-
117
-
118
-
119
 |
 |

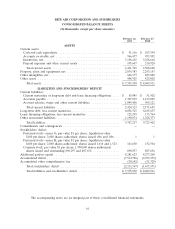
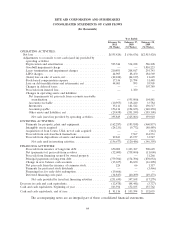
RITE AID CORPORATION AND SUBSIDIARIES
CONSOLIDATED BALANCE SHEETS
(In thousands, except per share amounts)
February 26, February 27,
2011 2010
ASSETS
Current assets:
Cash and cash equivalents ................................... $ 91,116 $ 103,594
Accounts receivable, net .................................... 966,457 955,502
Inventories, net ........................................... 3,158,145 3,238,644
Prepaid expenses and other current assets ....................... 195,647 210,928
Total current assets ...................................... 4,411,365 4,508,668
Property, plant and equipment, net .............................. 2,039,383 2,293,153
Other intangibles, net ........................................ 646,177 823,088
Other assets ............................................... 458,925 425,002
Total assets ............................................ $7,555,850 $ 8,049,911
LIABILITIES AND STOCKHOLDERS’ DEFICIT
Current liabilities:
Current maturities of long-term debt and lease financing obligations .... $ 63,045 $ 51,502
Accounts payable ......................................... 1,307,872 1,159,069
Accrued salaries, wages and other current liabilities ................ 1,049,406 965,121
Total current liabilities .................................... 2,420,323 2,175,692
Long-term debt, less current maturities ........................... 6,034,525 6,185,633
Lease financing obligations, less current maturities ................... 122,295 133,764
Other noncurrent liabilities .................................... 1,190,074 1,228,373
Total liabilities .......................................... 9,767,217 9,723,462
Commitments and contingencies ................................ — —
Stockholders’ deficit:
Preferred stock—series G, par value $1 per share; liquidation value
$100 per share; 2,000 shares authorized; shares issued .006 and .006 . . . 1 1
Preferred stock—series H, par value $1 per share; liquidation value
$100 per share; 2,000 shares authorized; shares issued 1,616 and 1,523 . 161,650 152,304
Common stock, par value $1 per share; 1,500,000 shares authorized;
shares issued and outstanding 890,297 and 887,636 ............... 890,297 887,636
Additional paid-in capital ..................................... 4,281,623 4,277,200
Accumulated deficit ......................................... (7,514,796) (6,959,372)
Accumulated other comprehensive loss ........................... (30,142) (31,320)
Total stockholders’ deficit .................................. (2,211,367) (1,673,551)
Total liabilities and stockholders’ deficit ....................... $7,555,850 $ 8,049,911
The accompanying notes are an integral part of these consolidated financial statements.
61