Rite Aid 2011 Annual Report Download - page 26
Download and view the complete annual report
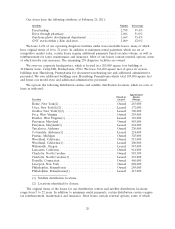
Please find page 26 of the 2011 Rite Aid annual report below. You can navigate through the pages in the report by either clicking on the pages listed below, or by using the keyword search tool below to find specific information within the annual report.-
 1
1 -
2
-
3
-
4
-
5
-
6
-
7
-
8
-
9
-
10
-
11
-
12
-
13
-
14
-
15
-
 16
16 -
 17
17 -
 18
18 -
 19
19 -
 20
20 -
 21
21 -
 22
22 -
 23
23 -
 24
24 -
 25
25 -
 26
26 -
 27
27 -
 28
28 -
 29
29 -
 30
30 -
 31
31 -
 32
32 -
 33
33 -
 34
34 -
 35
35 -
 36
36 -
37
-
38
-
39
-
40
-
41
-
42
-
43
-
44
-
45
-
46
-
47
-
48
-
49
-
50
-
51
-
52
-
53
-
54
-
55
-
56
-
57
-
58
-
59
-
60
-
61
-
62
-
63
-
64
-
65
-
66
-
67
-
68
-
69
-
70
-
71
-
72
-
73
-
74
-
75
-
76
-
77
-
78
-
79
-
80
-
81
-
82
-
83
-
84
-
85
-
86
-
87
-
88
-
89
-
90
-
91
-
92
-
93
-
94
-
95
-
96
-
97
-
98
-
99
-
100
-
101
-
102
-
103
-
104
-
105
-
106
-
107
-
108
-
109
-
110
-
111
-
112
-
113
-
114
-
115
-
116
-
117
-
118
-
119
 |
 |
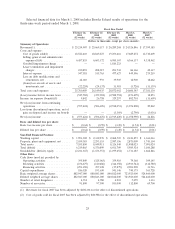
(3) Selling, general and administrative expenses for fiscal 2007 has been adjusted by $32,019 for the effect of
discontinued operations.
(4) Includes stock-based compensation expense. Stock based compensation expense for all fiscal years presented
was determined using the fair value method set forth in ASC 718, ‘‘Compensation—Stock Compensation.’’
(5) Income tax benefit for fiscal 2007 has been adjusted by $1,635 for the effect of discontinued operations.
(6) Total debt included capital lease obligations of $140.3 million, $152.7 million, $193.8 million, $216.3 million
and $189.7 million, as of February 26, 2011, February 27, 2010, February 28, 2009, March 1, 2008 and
March 3, 2007, respectively.
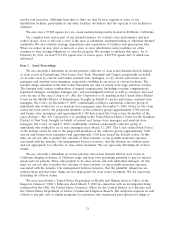
Item 7. Management’s Discussion and Analysis of Financial Condition and Results of Operations
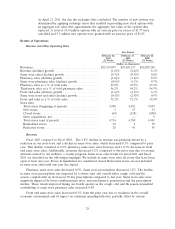
Overview
Net loss for fiscal 2011 was $555.4 million or $0.64 per basic and diluted share, compared to net
loss for 2010 of $506.7 million or $0.59 per basic and diluted share and a net loss for fiscal 2009 of
$2,915.4 million or $3.49 per basic and diluted share. Fiscal 2009 included significant non-cash charges
related to goodwill impairment, store impairment and an additional tax valuation allowance against
deferred tax assets that accounted for $2.2 billion or $2.70 per diluted share. Excluding these significant
non-cash charges, fiscal 2009’s net loss would have been $640 million or $0.79 per diluted share. Our
operating results are described in detail in the Results of Operations section of this Item 7. Some of
the key factors that impacted our results in fiscal 2011, 2010 and 2009 are summarized as follows:
Write-Off of Goodwill: During fiscal 2009, we impaired all of our existing goodwill, which resulted
in a non-cash charge of $1.81 billion. This entry was required due to the fact that the market value of
Rite Aid Corporation, as indicated by the trading price of our common stock, was less than the
carrying value of our net assets as of February 28, 2009.
Income Tax: Net loss for fiscal 2011 included income tax expense of $9.8 million and was
primarily comprised of an accrual for state and local taxes, adjustments to unrecognized tax benefits
and the need for an accrual of additional state taxes resulting from the receipt of a final audit
determination. We maintain a full valuation allowance against the net deferred tax assets. ASC 740,
‘‘Income Taxes’’ requires a company to evaluate its deferred tax assets on a regular basis to determine
if a valuation allowance against the net deferred tax assets is required. A cumulative loss in recent
years is significant negative evidence in considering whether deferred tax assets are realizable. Based on
the negative evidence, ASC 740 precludes relying on projections of future taxable income to support
the recognition of deferred tax assets.
Net loss for fiscal 2010 included income tax expense of $26.8 million. The income tax expense was
primarily due to an accrual for state and local taxes net of federal tax recoveries and adjustments to
unrecognized tax benefits. Net loss for fiscal 2009 included income tax expense of $329.3 million related
to a non-cash write-down of our remaining net federal and state deferred tax assets through an
adjustment to our valuation allowance. This change was primarily due to a decline in actual results
from our previous forecast as a result of the impact of current economic conditions on fiscal 2009
results.
Store Closing and Impairment Charges: We recorded store closing and impairment charges of
$210.9 million in fiscal 2011 compared to $208.0 million in fiscal 2010 and $293.7 million in store
closing and impairment charges in fiscal 2009.
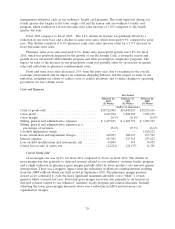
LIFO Charges: We record the value of our inventory on the Last-In, First-Out (LIFO) method.
We recorded non-cash LIFO charges of $44.9 million, $88.5 million and $184.6 million in fiscal 2011,
2010 and 2009, respectively. The higher LIFO charge in fiscal 2009 was due to higher inflation on front
end products in that year.
26