Rite Aid 2011 Annual Report Download - page 28
Download and view the complete annual report
Please find page 28 of the 2011 Rite Aid annual report below. You can navigate through the pages in the report by either clicking on the pages listed below, or by using the keyword search tool below to find specific information within the annual report.-
 1
1 -
2
-
3
-
4
-
5
-
6
-
7
-
8
-
9
-
10
-
11
-
12
-
13
-
14
-
15
-
16
-
17
-
 18
18 -
 19
19 -
 20
20 -
 21
21 -
 22
22 -
 23
23 -
 24
24 -
 25
25 -
 26
26 -
 27
27 -
 28
28 -
 29
29 -
 30
30 -
 31
31 -
 32
32 -
 33
33 -
 34
34 -
 35
35 -
 36
36 -
 37
37 -
 38
38 -
39
-
40
-
41
-
42
-
43
-
44
-
45
-
46
-
47
-
48
-
49
-
50
-
51
-
52
-
53
-
54
-
55
-
56
-
57
-
58
-
59
-
60
-
61
-
62
-
63
-
64
-
65
-
66
-
67
-
68
-
69
-
70
-
71
-
72
-
73
-
74
-
75
-
76
-
77
-
78
-
79
-
80
-
81
-
82
-
83
-
84
-
85
-
86
-
87
-
88
-
89
-
90
-
91
-
92
-
93
-
94
-
95
-
96
-
97
-
98
-
99
-
100
-
101
-
102
-
103
-
104
-
105
-
106
-
107
-
108
-
109
-
110
-
111
-
112
-
113
-
114
-
115
-
116
-
117
-
118
-
119
 |
 |

on April 21, 2011, the day the exchange offer concluded. The number of new options was
determined by applying exchange ratios that resulted in providing new stock options with
an aggregate fair value that approximates the aggregate fair value of the options they
replaced. A total of 14.0 million options with an exercise price in excess of $1.77 were
cancelled and 5.3 million new options were granted with an exercise price of $1.03.
Results of Operations
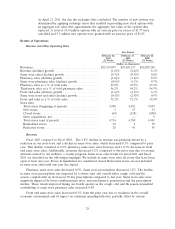
Revenue and Other Operating Data
Year Ended
February 26, February 27, February 28,
2011 2010 2009
(52 Weeks) (52 Weeks) (52 Weeks)
(Dollars in thousands)
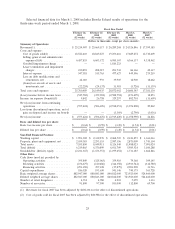
Revenues ..................................... $25,214,907 $25,669,117 $26,289,268
Revenue (decline) growth ......................... (1.8)% (2.4)% 8.1%
Same store sales (decline) growth ................... (0.7)% (0.9)% 0.8%
Pharmacy sales (decline) growth .................... (1.8)% (1.4)% 8.5%
Same store pharmacy sales (decline) growth ........... (0.9)% 0.1% 0.7%
Pharmacy sales as a % of total sales ................. 67.8% 67.9% 67.2%
Third party sales as a % of total pharmacy sales ........ 96.2% 96.2% 96.3%
Front end sales (decline) growth .................... (1.6)% (4.3)% 6.1%
Same store front end sales (decline) growth ............ (0.3)% (2.9)% 0.9%
Front end sales as a % of total sales ................. 32.2% 32.1% 32.8%
Store data:
Total stores (beginning of period) ................. 4,780 4,901 5,059
New stores .................................. 3 17 33
Closed stores ................................ (69) (138) (200)
Store acquisitions, net .......................... — — 9
Total stores (end of period) ...................... 4,714 4,780 4,901
Remodeled stores ............................. 19 8 70
Relocated stores .............................. 28 41 56
Revenues
Fiscal 2011 compared to Fiscal 2010: The 1.8% decline in revenue was primarily driven by a
reduction in our store base and a decline in same store sales, which decreased 0.7% compared to prior
year. This decline consisted of 0.9% pharmacy same store sales decrease and a 0.3% decrease in front
end same store sales. Additionally, revenues decreased 0.2% compared to the prior year due to revenue
deferrals related to our wellness + loyalty program. Same store sales trends for fiscal 2011 and fiscal
2010 are described in the following paragraphs. We include in same store sales all stores that have been
open at least one year. Stores in liquidation are considered closed. Relocation stores are not included
in same store sales until one year has lapsed.
Pharmacy same store sales decreased 0.9%. Same store prescriptions decreased 1.2%. The decline
in same store prescriptions was impacted by a slower start and overall softer cough, cold and flu
season, coupled with an increase in 90-day prescriptions compared to last year. Same store sales were
negatively impacted by lower reimbursement rates, increased generic penetration and the prescription
decline. These trends improved during our fourth quarter as the cough, cold and flu season intensified
contributing to same store pharmacy sales increased 0.8%.
Front end same store sales decreased 0.3% from the prior year due to weakness in the overall
economic environment and its impact on consumer spending behavior, partially offset by various
28