Red Lobster 2005 Annual Report Download - page 52
Download and view the complete annual report
Please find page 52 of the 2005 Red Lobster annual report below. You can navigate through the pages in the report by either clicking on the pages listed below, or by using the keyword search tool below to find specific information within the annual report.-
 1
1 -
2
-
3
-
4
-
5
-
6
-
7
-
8
-
9
-
10
-
11
-
12
-
13
-
14
-
15
-
16
-
17
-
18
-
19
-
20
-
21
-
22
-
23
-
24
-
25
-
26
-
27
-
28
-
29
-
30
-
31
-
32
-
33
-
34
-
35
-
36
-
37
-
38
-
39
-
40
-
41
-
 42
42 -
 43
43 -
 44
44 -
 45
45 -
 46
46 -
 47
47 -
 48
48 -
 49
49 -
 50
50 -
 51
51 -
 52
52
 |
 |

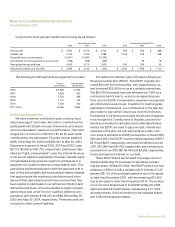
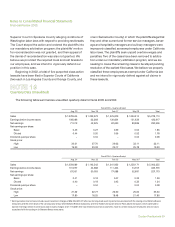
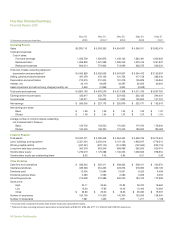
60 Darden Restaurants
May 29, May 30, May 25, May 26, May 27,
(In thousands, except per share data) 2005 2004
(1)
2003 2002 2001
Operating Results
Sales $5,278,110 $ 5,003,355 $ 4,654,971 $ 4,366,911 $ 3,992,419
Costs and expenses:
Cost of sales:
Food and beverage 1,593,709 1,526,875 1,449,162 1,384,481 1,302,926
Restaurant labor 1,695,805 1,601,258 1,485,046 1,373,416 1,261,837
Restaurant expenses 806,314 774,806 713,699 636,575 566,234
Total cost of sales, excluding restaurant
depreciation and amortization
(2)
$ 4,095,828 $ 3,902,939 $ 3,647,907 $ 3,394,472 $ 3,130,997
Selling, general and administrative 497,478 472,109 431,722 417,158 389,240
Depreciation and amortization 213,219 210,004 191,218 165,829 146,864
Interest, net 43,119 43,659 42,597 36,585 30,664
Asset impairment and restructuring charges (credits), net 4,549 41,868 3,924 (2,568) –
Total costs and expenses $ 4,854,193 $ 4,670,579 $ 4,317,368 $ 4,011,476 $ 3,697,765
Earnings before income taxes 423,917 332,776 337,603 355,435 294,654
Income taxes 133,311 105,603 111,624 122,664 101,707
Net earnings $ 290,606 $ 227,173 $ 225,979 $ 232.771 $ 192,947
Net earnings per share:
Basic $ 1.85 $ 1.39 $ 1.33 $ 1.33 $ 1.07
Diluted $ 1.78 $ 1.34 $ 1.27 $ 1.27 $ 1.04
Average number of common shares outstanding,
net of shares held in Treasury:
Basic 156,700 163,500 170,300 174,700 179,600
Diluted 163,400 169,700 177,400 183,500 185,600
Financial Position
Total assets $ 2,937,771 $ 2,780,348 $ 2,664,633 $ 2,529,736 $ 2,216,534
Land, buildings, and equipment 2,351,454 2,250,616 2,157,132 1,926,947 1,779,515
Working capital (deficit) (637,341) (337,174) (314,280) (157,662) (226,116)
Long-term debt less current portion 350,318 653,349 658,086 662,506 520,574
Stockholders’ equity 1,273,019 1,175,288 1,130,055 1,069,606 978,954
Stockholders’ equity per outstanding share 8.25 7.42 6.85 6.21 5.56
Other Statistics
Cash flow from operations $ 583,242 $ 525,411 $ 508,635 $ 508,101 $ 420,570
Capital expenditures 329,238 354,326 423,273 318,392 355,139
Dividends paid 12,505 12,984 13,501 9,225 9,458
Dividends paid per share 0.080 0.080 0.080 0.053 0.053
Advertising expense 214,608 210,989 200,020 184,163 177,998
Stock price:
High 33.11 25.60 27.83 29.767 19.660
Low 19.30 17.80 16.46 15.400 10.292
Close $ 32.80 $ 22.50 $ 18.35 $ 25.030 $ 19.267
Number of employees 150,100 141,300 140,700 133,200 128,900
Number of restaurants 1,381 1,325 1,271 1,211 1,168
(1)
Fiscal year 2004 consisted of 53 weeks while all other fiscal years consisted of 52 weeks.
(2)
Total cost of sales, excluding restaurant depreciation and amortization of $198,422, $195,486, $177,127, $155,837 and $138,229, respectively.
Five-Year Financial Summary
Financial Review 2005