Red Lobster 2005 Annual Report Download - page 23
Download and view the complete annual report
Please find page 23 of the 2005 Red Lobster annual report below. You can navigate through the pages in the report by either clicking on the pages listed below, or by using the keyword search tool below to find specific information within the annual report.-
 1
1 -
2
-
3
-
4
-
5
-
6
-
7
-
8
-
9
-
10
-
11
-
12
-
 13
13 -
 14
14 -
 15
15 -
 16
16 -
 17
17 -
 18
18 -
 19
19 -
 20
20 -
 21
21 -
 22
22 -
 23
23 -
 24
24 -
 25
25 -
 26
26 -
 27
27 -
 28
28 -
 29
29 -
 30
30 -
 31
31 -
 32
32 -
 33
33 -
34
-
35
-
36
-
37
-
38
-
39
-
40
-
41
-
42
-
43
-
44
-
45
-
46
-
47
-
48
-
49
-
50
-
51
-
52
 |
 |
Management’s Discussion and Analysis of Financial Condition and Results of Operations
Financial Review 2005
Darden Restaurants 31
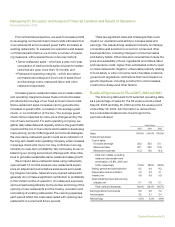
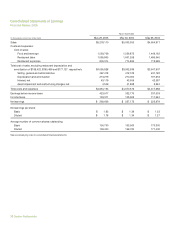
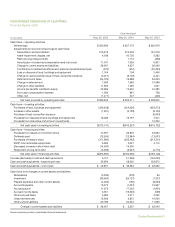
Net cash flows provided by operating activities were
$583 million, $525 million and $509 million in fiscal 2005,
2004 and 2003, respectively. Net cash flows provided by
operating activities include net earnings of $291 million,
$227 million and $226 million in fiscal 2005, 2004 and
2003, respectively. Fiscal 2004 net earnings included a
$36.5 million pre-tax ($22.4 million after-tax) charge for
long-lived asset impairments associated with the closing
of six Bahama Breeze restaurants and the write-down of
the carrying value of four other Bahama Breeze restau-
rants, one Olive Garden restaurant and one Red Lobster
restaurant, which continued to operate. Net cash flows
provided by operating activities also reflect income tax
payments of $111 million, $92 million and $65 million in
fiscal 2005, 2004 and 2003, respectively. The increase in
tax payments in fiscal 2005 and 2004 resulted primarily
from accelerated deductions allowable for depreciation
of certain capital expenditures in fiscal 2004 and 2003,
which lowered our income tax payments in those fiscal
years. These accelerated deductions were allowable
for only a portion of fiscal 2005 capital expenditures.
In fiscal 2005, however, the impact of the reduction in
accelerated depreciation deductions was partially offset
by an increase in income tax benefits associated with the
exercise of employee stock options.
Net cash flows used in financing activities were $264
million, $194 million and $193 million in fiscal 2005, 2004
and 2003, respectively. Net cash flows used in financing
activities included our repurchase of 11.3 million shares
of our common stock for $312 million in fiscal 2005,
compared to 10.7 million shares for $235 million in fiscal
2004 and 10.7 million shares for $213 million in fiscal
2003. Our Board of Directors has authorized us to repur-
chase up to 137.4 million shares of our common stock.
At May 29, 2005 a total of 120.6 million shares have been
repurchased under the authorization. The repurchased
common stock is reflected as a reduction of stockhold-
ers’ equity. We received proceeds from the issuance of
common stock upon the exercise of stock options of $75
million, $40 million and $34 million in fiscal 2005, 2004
and 2003, respectively. Net cash flows used in financing
activities also included dividends paid to stockholders
of $13 million, $13 million and $14 million in fiscal 2005,
2004 and 2003, respectively.
Net cash flows used in investing activities were $313
million, $343 million and $420 million in fiscal 2005, 2004
and 2003, respectively. Net cash flows used in investing
activities included capital expenditures incurred princi-
pally for building new restaurants, replacing equipment
and remodeling existing restaurants. Capital expenditures
were $329 million in fiscal 2005, compared to $354 mil-
lion in fiscal 2004 and $423 million in fiscal 2003. The
decreased expenditures in fiscal 2005 and 2004 resulted
primarily from decreased spending associated with
building fewer new restaurants and fewer remodels. We
estimate that our fiscal 2006 capital expenditures will
approximate $350 million to $375 million.
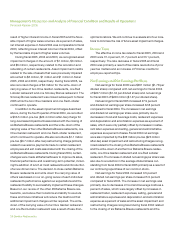
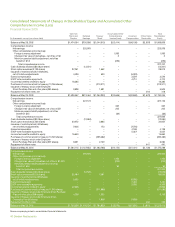
Net cash flows provided by operating activities for fiscal
2003 included a $20 million contribution to our defined
benefit pension plans, which enabled the plans to main-
tain a fully funded status as of the plans’ February 28,
2003 annual valuation date. Approximately $0.1 million
was required to fund our defined benefit pension plans in
fiscal 2005 and fiscal 2004. Our defined benefit and other
postretirement benefit costs and liabilities are calculated
using various actuarial assumptions and methodologies
prescribed under the Financial Accounting Standards
Board’s (FASB) Statement of Financial Accounting
Standards (SFAS) No. 87, “Employers’ Accounting for
Pensions” and No. 106, “Employers’ Accounting for
Postretirement Benefits Other Than Pensions.” We use
certain assumptions including, but not limited to, the
selection of a discount rate, expected long-term rate of
return on plan assets and expected health care cost trend
rates. We set the discount rate assumption annually for
each plan at its valuation date to reflect the yield of high
quality fixed-income debt instruments, with lives that
approximate the maturity of the plan benefits. At May 29,
2005, our discount rate was 5.75 percent. The expected
long-term rate of return on plan assets and health care
cost trend rates are based upon several factors, includ-
ing our historical assumptions compared with actual
results, an analysis of current market conditions, asset
allocations and the views of leading financial advisers and
economists. Based on our analysis during fiscal 2003, we
lowered our defined benefit plans’ expected long-term
rate of return on plan assets for fiscal 2004 from 10.4
percent to 9.0 percent. The change in our defined benefit