Red Lobster 2005 Annual Report Download - page 33
Download and view the complete annual report
Please find page 33 of the 2005 Red Lobster annual report below. You can navigate through the pages in the report by either clicking on the pages listed below, or by using the keyword search tool below to find specific information within the annual report.-
 1
1 -
2
-
3
-
4
-
5
-
6
-
7
-
8
-
9
-
10
-
11
-
12
-
13
-
14
-
15
-
16
-
17
-
18
-
19
-
20
-
21
-
22
-
 23
23 -
 24
24 -
 25
25 -
 26
26 -
 27
27 -
 28
28 -
 29
29 -
 30
30 -
 31
31 -
 32
32 -
 33
33 -
 34
34 -
 35
35 -
 36
36 -
 37
37 -
 38
38 -
 39
39 -
 40
40 -
 41
41 -
 42
42 -
 43
43 -
44
-
45
-
46
-
47
-
48
-
49
-
50
-
51
-
52
 |
 |

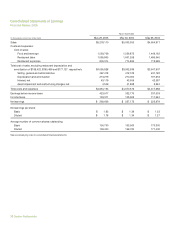
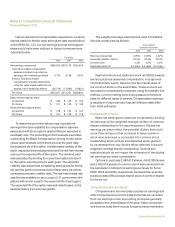
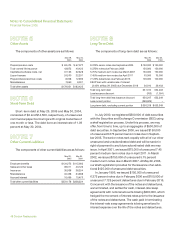
Consolidated Statements of Cash Flows
Financial Review 2005
Fiscal Year Ended
(In thousands) May 29, 2005 May 30, 2004 May 25, 2003
Cash flows – operating activities
Net earnings $ 290,606 $ 227,173 $ 225,979
Adjustments to reconcile net earnings to cash flows:
Depreciation and amortization 213,219 210,004 191,218
Asset impairment charges, net 4,549 40,756 4,282
Restructuring charge (credit) – 1,112 (358)
Amortization of unearned compensation and loan costs 11,041 7,599 6,901
Change in current assets and liabilities 28,967 2,207 36,046
Contribution to defined benefit pension plans and postretirement plan (575) (257) (20,203)
Loss on disposal of land, buildings and equipment 1,164 104 2,456
Change in cash surrender value of trust-owned life insurance (3,451) (6,106) 2,441
Deferred income taxes (24,722) 16,688 32,026
Change in deferred rent 7,993 7,583 10,098
Change in other liabilities 11,920 1,490 1,051
Income tax benefits credited to equity 42,996 15,650 16,385
Non-cash compensation expense 1,006 861 758
Other, net (1,471) 547 (445)
Net cash provided by operating activities $ 583,242 $ 525,411 $ 508,635
Cash flows – investing activities
Purchases of land, buildings and equipment (329,238) (354,326) (423,273)
Increase in other assets (1,931) (5,128) (8,100)
Purchase of trust-owned life insurance – – (6,000)
Proceeds from disposal of land, buildings and equipment 18,028 16,197 7,641
Proceeds from maturities of short-term investments – – 10,000
Net cash used in investing activities $(313,141) $(343,257) $(419,732)
Cash flows – financing activities
Proceeds from issuance of common stock 74,697 39,856 33,664
Dividends paid (12,505) (12,984) (13,501)
Purchases of treasury stock (311,686) (235,462) (213,311)
ESOP note receivable repayments 3,393 5,027 4,710
(Decrease) increase in short-term debt (14,500) 14,500 –
Repayment of long-term debt (3,393) (5,027) (4,710)
Net cash used in financing activities $(263,994) $(194,090) $(193,148)
Increase (decrease) in cash and cash equivalents 6,107 (11,936) (104,245)
Cash and cash equivalents – beginning of year 36,694 48,630 152,875
Cash and cash equivalents – end of year $ 42,801 $ 36,694 $ 48,630
Cash flows from changes in current assets and liabilities
Receivables (5,533) (279) 66
Inventories (36,663) (25,137) (1,231)
Prepaid expenses and other current assets (4,463) (190) (8,523)
Accounts payable 16,573 (1,027) 15,927
Accrued payroll 11,275 17,352 (1,961)
Accrued income taxes 3,651 (19,222) (529)
Other accrued taxes 5,385 3,371 4,595
Unearned revenues 12,959 2,815 16,066
Other current liabilities 25,783 24,524 11,636
Change in current assets and liabilities $ 28,967 $ 2,207 $ 36,046
See accompanying notes to consolidated financial statements.
Darden Restaurants 41