Red Lobster 2005 Annual Report Download - page 24
Download and view the complete annual report
Please find page 24 of the 2005 Red Lobster annual report below. You can navigate through the pages in the report by either clicking on the pages listed below, or by using the keyword search tool below to find specific information within the annual report.-
 1
1 -
2
-
3
-
4
-
5
-
6
-
7
-
8
-
9
-
10
-
11
-
12
-
13
-
 14
14 -
 15
15 -
 16
16 -
 17
17 -
 18
18 -
 19
19 -
 20
20 -
 21
21 -
 22
22 -
 23
23 -
 24
24 -
 25
25 -
 26
26 -
 27
27 -
 28
28 -
 29
29 -
 30
30 -
 31
31 -
 32
32 -
 33
33 -
 34
34 -
35
-
36
-
37
-
38
-
39
-
40
-
41
-
42
-
43
-
44
-
45
-
46
-
47
-
48
-
49
-
50
-
51
-
52
 |
 |
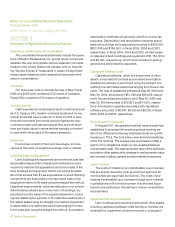
Management’s Discussion and Analysis of Financial Condition and Results of Operations
Financial Review 2005
32 Darden Restaurants
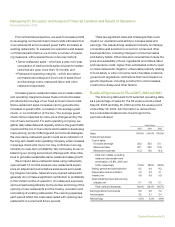
plans’ expected long-term rate of return on plan assets
decreased earnings before income taxes by approximately
$2 million in fiscal 2004. At May 29, 2005, our expected
health care cost trend rates ranged from 11.0 percent to
12.0 percent for fiscal 2006, depending on the medical
service category. The rates gradually decrease to 5.0 per-
cent through fiscal 2011 and remain at that level thereafter.
The expected long-term rate of return on plan assets
component of our net periodic benefit cost is calculated
based on the market-related value of plan assets. Our
target asset allocation is 35 percent U.S. equities, 30 per-
cent high-quality, long-duration fixed-income securities,
15 percent international equities, 10 percent private equi-
ties and 10 percent real assets. We monitor our actual
asset allocation to ensure that it approximates our target
allocation and believe that our long-term asset allocation
will continue to approximate our target allocation. Our
historical ten-year rate of return on plan assets, calcu-
lated using the geometric method average of returns, is
approximately 10.9 percent as of May 29, 2005.
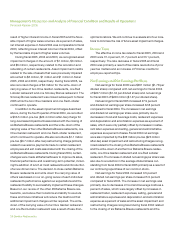
We have an unrecognized net actuarial loss for the
defined benefit plans and postretirement benefit plan as
of May 29, 2005 of $59 million and $4 million, respec-
tively. The unrecognized net actuarial loss represents
changes in the amount of the projected benefit obligation
and plan assets resulting from differences in the assump-
tions used and actual experience. The amortization of the
unrecognized net actuarial loss component of our fiscal
2006 net periodic benefit cost for the defined benefit
plans and postretirement benefit plan is expected to be
approximately $5 million and $0.2 million, respectively.
We believe our defined benefit and postretirement
benefit plan assumptions are appropriate based upon the
factors discussed above. However, other assumptions
could also be reasonably applied that could differ from the
assumptions used. A quarter percentage point change in
the defined benefit plans’ discount rate and the expected
long-term rate of return on plan assets would increase or
decrease earnings before income taxes by $0.7 million and
$0.4 million, respectively. A quarter percentage point
change in our postretirement benefit plan discount rate
would increase or decrease earnings before income taxes
by $0.1 million. A one percentage point increase in the health
care cost trend rates would increase the accumulated
postretirement benefit obligation (APBO) by $4 million at
May 29, 2005 and the aggregate of the service cost and
interest cost components of net periodic postretirement
benefit cost by $0.6 million for fiscal 2005. A one percent-
age point decrease in the health care cost trend rates would
decrease the APBO by $3 million at May 29, 2005 and the
aggregate of the service cost and interest cost components
of net periodic postretirement benefit cost by $0.5 million
for fiscal 2005. These changes in assumptions would not
significantly impact our funding requirements.
We are not aware of any trends or events that would
materially affect our capital requirements or liquidity. We
believe that our internal cash-generating capabilities,
borrowings available under our shelf registration for
unsecured debt securities and short-term commercial
paper program should be sufficient to finance our capital
expenditures, debt maturities, stock repurchase program
and other operating activities through fiscal 2006.
Off-Balance Sheet Arrangements
We are not a party to any off-balance sheet arrange-
ments that have, or are reasonably likely to have, a current
or future material effect on our financial condition, changes
in financial condition, sales or expenses, results of opera-
tions, liquidity, capital expenditures or capital resources.
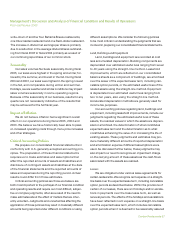
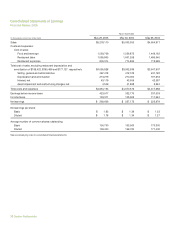
Financial Condition
Our total current assets were $407 million at May 29,
2005, compared to $346 million at May 30, 2004. The
increase resulted primarily from increases in inventories
of $37 million that resulted from opportunistic product
purchases made during fiscal 2005.
Our total current liabilities were $1.04 billion at May 29,
2005, compared to $0.68 billion at May 30, 2004. The
increase in current liabilities is primarily due to the reclas-
sification of the $150 million of unsecured 8.375 percent
senior notes due in September 2005 and the $150 million
of unsecured 6.375 percent notes due in February 2006
from long-term debt to current liabilities. Accounts payable
of $191 million at May 29, 2005 increased from $175 mil-
lion, primarily due to the timing of our inventory and capital
expenditures at the end of fiscal 2005. Other current