Red Lobster 2005 Annual Report Download - page 16
Download and view the complete annual report
Please find page 16 of the 2005 Red Lobster annual report below. You can navigate through the pages in the report by either clicking on the pages listed below, or by using the keyword search tool below to find specific information within the annual report.Management’s Discussion and Analysis of Financial Condition and Results of Operations
Financial Review 2005
24 Darden Restaurants
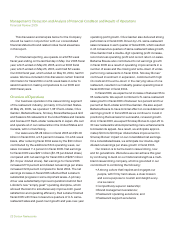
Sales
Sales were $5.28 billion in fiscal 2005, $5.00 billion in
fiscal 2004 and $4.65 billion in fiscal 2003. The 5.5 percent
increase in company-wide sales for fiscal 2005 was primar-
ily due to a net increase of 56 company-owned restaurants
compared to fiscal 2004 and same-restaurant sales increases
at Olive Garden. These sales increases were partially offset
by the additional operating week in fiscal 2004. After reducing
fiscal 2004 sales by the $90 million contributed by the addi-
tional operating week, sales would have been $4.91 billion
for fiscal 2004 on a 52-week basis, resulting in a 7.4 percent
increase in fiscal 2005.
Red Lobster sales were $2.44 billion in both fiscal
2005 and fiscal 2004. U.S. same-restaurant sales for Red
Lobster increased 0.9 percent (on a 52-week basis) due to
a 1.9 percent increase in average check offset partially by
a 1.0 percent decrease in same-restaurant guest counts.
Average annual sales per restaurant for Red Lobster were
$3.6 million in fiscal 2005.
Olive Garden sales of $2.40 billion were 8.5 percent
above last year. U.S. same-restaurant sales for Olive
Garden increased 7.2 percent (on a 52-week basis) due to a
5.3 percent increase in same-restaurant guest counts and
a 1.9 percent increase in average check. Average annual
sales per restaurant for Olive Garden were $4.4 million
in fiscal 2005. Olive Garden has enjoyed 43 consecutive
quarters of U.S. same-restaurant sales increases.
Bahama Breeze sales of $164 million were 7.2 percent
below last year. Same-restaurant sales for Bahama Breeze
decreased 1.6 percent (on a 52-week basis) for fiscal 2005.
Bahama Breeze also had six fewer restaurants in operation
during fiscal 2005. Average annual sales per restaurant for
Bahama Breeze were $5.1 million in fiscal 2005.
Smokey Bones sales of $269 million were 54.6 percent
above last year. Same-restaurant sales for Smokey Bones
increased 1.1 percent (on a 52-week basis) for fiscal 2005.
Average annual sales per restaurant were $3.1 million, with
appreciable variation by region. Smokey Bones opened 35
new restaurants during fiscal 2005.
The 7.5 percent increase in company-wide sales for
fiscal 2004 versus fiscal 2003 was primarily due to a net
increase of 54 company-owned restaurants compared to
fiscal 2003, same-restaurant sales increases at Olive
Garden and the additional operating week in fiscal 2004.
After reducing fiscal 2004 sales by the $90 million contrib-
uted by the additional operating week, total sales increased
5.5 percent from fiscal 2003. These sales increases were
partially offset by decreased U.S. same-restaurant sales at
Red Lobster. While Red Lobster’s sales of $2.44 billion were
0.1 percent above fiscal 2003, its U.S. same-restaurant
sales decreased 3.5 percent (on a 52-week basis) due to
a 6.5 percent decrease in same-restaurant guest counts,
partially offset by a 3.0 percent increase in average check.
Average annual sales per restaurant for Red Lobster were
$3.6 million in fiscal 2004 (on a 52-week basis). Olive Garden
sales of $2.21 billion were 11.1 percent above fiscal 2003.
U.S. same-restaurant sales for Olive Garden increased 4.6
percent (on a 52-week basis) due to a 3.0 percent increase in
average check and a 1.6 percent increase in same-restaurant
guest counts. Average annual sales per restaurant for Olive
Garden were $4.1 million in fiscal 2004 (on a 52-week basis).
Bahama Breeze sales of $176 million were 28 percent above
fiscal 2003. Bahama Breeze opened four new restaurants
during fiscal 2004, including its new prototype restaurant in
Pittsburgh, PA. Bahama Breeze also closed six restaurants
during the fourth quarter of fiscal 2004 as a result of a com-
prehensive analysis performed during the fourth quarter of
fiscal 2004 that examined restaurants not meeting our min-
imum return-on-investment thresholds and certain other
operating performance criteria. Average annual sales per
restaurant (excluding the six closed restaurants) were
$5.2 million (on a 52-week basis). Smokey Bones sales of
$174 million were 87 percent higher in fiscal 2004 than in
fiscal 2003, its average annual sales per restaurant were
$3.2 million (on a 52-week basis) and it opened 30 new
restaurants during fiscal 2004.
Costs and Expenses
Total costs and expenses were $4.85 billion in fiscal
2005, $4.67 billion in fiscal 2004 and $4.32 billion in fiscal
2003. Total costs and expenses in fiscal 2005 were 92.0
percent of sales, a decrease from 93.4 percent of sales in
fiscal 2004 and 92.7 percent of sales in fiscal 2003.
Food and beverage costs increased $67 million, or
4.4 percent, from $1.53 billion to $1.59 billion in fiscal
2005 compared to fiscal 2004. Food and beverage costs
increased $78 million, or 5.4 percent, from $1.45 billion to
$1.53 billion in fiscal 2004 compared to fiscal 2003. As a


