Red Lobster 2005 Annual Report Download - page 22
Download and view the complete annual report
Please find page 22 of the 2005 Red Lobster annual report below. You can navigate through the pages in the report by either clicking on the pages listed below, or by using the keyword search tool below to find specific information within the annual report.-
 1
1 -
2
-
3
-
4
-
5
-
6
-
7
-
8
-
9
-
10
-
11
-
 12
12 -
 13
13 -
 14
14 -
 15
15 -
 16
16 -
 17
17 -
 18
18 -
 19
19 -
 20
20 -
 21
21 -
 22
22 -
 23
23 -
 24
24 -
 25
25 -
 26
26 -
 27
27 -
 28
28 -
 29
29 -
 30
30 -
 31
31 -
 32
32 -
33
-
34
-
35
-
36
-
37
-
38
-
39
-
40
-
41
-
42
-
43
-
44
-
45
-
46
-
47
-
48
-
49
-
50
-
51
-
52
 |
 |
Management’s Discussion and Analysis of Financial Condition and Results of Operations
Financial Review 2005
30 Darden Restaurants
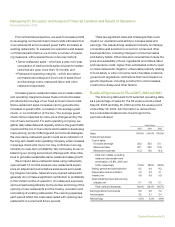
A summary of our contractual obligations and commercial commitments at May 29, 2005, is as follows (in thousands):
Payments Due by Period
Contractual Obligations Total Less than 1 Year 1-3 Years 3-5 Years More than 5 Years
Long-term debt
(1)
$ 799,260 $338,025 $185,396 $ 26,163 $249,676
Operating leases 419,543 68,301 119,710 88,464 143,068
Purchase obligations
(2)
579,008 562,930 14,492 1,586 –
Benefit obligations
(3)
160,178 13,407 28,061 30,345 88,365
Total contractual obligations $1,957,989 $982,663 $347,659 $146,558 $481,109
Amount of Commitment Expiration per Period
Other Commercial Commitments Total Amounts Committed Less than 1 Year 1-3 Years 3-5 Years More than 5 Years
Standby letters of credit
(4)
$86,506 $86,506 $ – $ – $ –
Guarantees
(5)
1,768 499 719 345 205
Total commercial commitments $88,274 $87,005 $719 $345 $205
1) Includes interest payments associated with existing long-term debt, including the current portion. Variable-rate interest payments associated with the ESOP loan were estimated
based on the interest rate in effect at May 29, 2005 (3.42 percent). Excludes issuance discount of $763.
2) Includes commitments for food and beverage items and supplies, capital projects and other miscellaneous commitments.
3) Includes expected payments associated with our defined benefit plans, postretirement benefit plan and our non-qualified deferred compensation plan through fiscal 2015.
4) Includes letters of credit for $72,677 of workers’ compensation and general liabilities accrued in our consolidated financial statements; also includes letters of credit for $4,495
of lease payments included in contractual operating lease obligation payments noted above.
5) Consists solely of guarantees associated with leased properties that have been assigned to third parties. We are not aware of any non-performance under these arrangements
that would result in us having to perform in accordance with the terms of the guarantees.
As disclosed in Exhibit 12 to this Form 10-K, our
fixed-charge coverage ratio, which measures the number
of times each year that we earn enough to cover our
fixed charges, amounted to 6.8 times and 5.7 times for
the fiscal years ended May 29, 2005 and May 30, 2004,
respectively. Our adjusted debt to adjusted total capital
ratio (which includes 6.25 times the total annual restau-
rant minimum rent ($62.1 million and $56.5 million for
the fiscal years ended May 29, 2005 and May 30, 2004,
respectively) and 3.00 times the total annual restaurant
equipment minimum rent ($0.0 million and $0.1 million for
the fiscal years ended May 29, 2005 and May 30, 2004,
respectively) as components of adjusted debt and
adjusted total capital) was 45 percent and 46 percent
at May 29, 2005 and May 30, 2004, respectively. We use
the lease-debt equivalent in our adjusted debt to adjusted
total capital ratio as we believe its inclusion better
represents the optimal capital structure that we target
from period to period.
Based on these ratios, we believe our financial condi-
tion is strong. The composition of our capital structure is
shown in the following table.
(In millions, except ratios) May 29, 2005 May 30, 2004
CAPITAL STRUCTURE
Short-term debt $ – $ 15
Current portion of long-term debt 300 –
Long-term debt 350 653
Stockholders’ equity 1,273 1,175
Total capital $1,923 $1,843
ADJUSTMENTS TO CAPITAL
Short-term debt $ – $ 15
Current portion of long-term debt 300 –
Long-term debt 350 653
Lease-debt equivalent 385 353
Adjusted debt $1,035 $1,021
Stockholders’ equity 1,273 1,175
Adjusted total capital $2,308 $2,196
CAPITAL STRUCTURE RATIOS
Debt to total capital ratio 34% 36%
Adjusted debt to adjusted total capital ratio 45% 46%