Red Lobster 2005 Annual Report Download - page 15
Download and view the complete annual report
Please find page 15 of the 2005 Red Lobster annual report below. You can navigate through the pages in the report by either clicking on the pages listed below, or by using the keyword search tool below to find specific information within the annual report.-
 1
1 -
2
-
3
-
4
-
 5
5 -
 6
6 -
 7
7 -
 8
8 -
 9
9 -
 10
10 -
 11
11 -
 12
12 -
 13
13 -
 14
14 -
 15
15 -
 16
16 -
 17
17 -
 18
18 -
 19
19 -
 20
20 -
 21
21 -
 22
22 -
 23
23 -
 24
24 -
 25
25 -
26
-
27
-
28
-
29
-
30
-
31
-
32
-
33
-
34
-
35
-
36
-
37
-
38
-
39
-
40
-
41
-
42
-
43
-
44
-
45
-
46
-
47
-
48
-
49
-
50
-
51
-
52
 |
 |

From a financial perspective, we seek to increase profits
by leveraging our fixed and semi-fixed costs with sales from
new restaurants and increased guest traffic and sales at
existing restaurants. To evaluate our operations and assess
our financial performance, we monitor a number of operat-
ing measures, with a special focus on two key factors:
• Same-restaurant sales – which are a year-over-year
comparison of each period’s sales volumes for restau-
rants that are open more than 16 months; and
• Restaurant operating margins – which are restau-
rant sales less restaurant-level cost of sales (food
and beverage costs, restaurant labor and other
restaurant expenses).
Increasing same-restaurant sales can increase restau-
rant operating margins because these incremental sales
provide better leverage of our fixed and semi-fixed costs.
Same-restaurant sales increases can be generated by
increases in guest traffic, increases in the average guest
check, or a combination of the two. The average guest
check can be impacted by menu price changes and by the
mix of menu items sold. For each operating company, we
gather daily sales data and regularly analyze the guest traffic
counts and the mix of menu items sold to assist in developing
menu pricing, product offerings and promotional strategies.
We view same-restaurant guest counts as an indication of
the long-term health of an operating company, while increases
in average check and menu mix may contribute more sig-
nificantly to near-term profitability. We continually focus on
balancing our pricing and product offerings with other initia-
tives to generate sustainable same-restaurant sales growth.
We compute same-restaurant sales using restaurants
open at least 16 months because new restaurants experi-
ence an adjustment period before sales levels and operat-
ing margins normalize. Sales at newly opened restaurants
generally do not make a significant contribution to profitability
in their initial months of operation. Our sales and expenses
can be impacted significantly by the number and timing of the
opening of new restaurants and the closing, relocation and
remodeling of existing restaurants. Pre-opening expenses
each period reflect the costs associated with opening new
restaurants in current and future periods.
There are significant risks and challenges that could
impact our operations and ability to increase sales and
earnings. The casual dining restaurant industry is intensely
competitive and sensitive to economic cycles and other
business factors, including changes in consumer tastes
and dietary habits. Other risks and uncertainties include the
price and availability of food, ingredients and utilities; labor
and insurance costs; higher-than-anticipated costs to open
or close restaurants; litigation; unfavorable publicity relating
to food safety or other concerns; lack of suitable locations;
government regulations; and factors that could impact our
growth objectives, including construction cost increases,
construction delays and other factors.
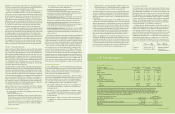
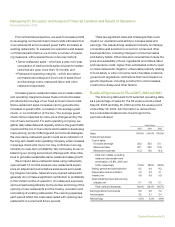
Results of Operations for Fiscal 2005, 2004 and 2003
The following table sets forth selected operating data
as a percentage of sales for the 52-week periods ended
May 29, 2005 and May 25, 2003 and the 53-week period
ended May 30, 2004. All information is derived from
the consolidated statements of earnings for the
periods indicated.
Fiscal Years
2005 2004 2003
Sales 100.0% 100.0% 100.0%
Costs and expenses:
Cost of sales:
Food and beverage 30.2 30.5 31.1
Restaurant labor 32.1 32.0 31.9
Restaurant expenses 15.3 15.5 15.3
Total cost of sales, excluding
restaurant depreciation and
amortization of 3.8%, 3.9% and
3.8%, respectively 77.6% 78.0% 78.3%
Selling, general and administrative 9.5 9.4 9.3
Depreciation and amortization 4.0 4.2 4.1
Interest, net 0.8 0.9 0.9
Asset impairment and restructuring
charges, net 0.1 0.9 0.1
Total costs and expenses 92.0% 93.4% 92.7%
Earnings before income taxes 8.0 6.6 7.3
Income taxes 2.5 2.1 2.4
Net earnings 5.5% 4.5% 4.9%
Management’s Discussion and Analysis of Financial Condition and Results of Operations
Financial Review 2005
Darden Restaurants 23