Red Lobster 2005 Annual Report Download - page 49
Download and view the complete annual report
Please find page 49 of the 2005 Red Lobster annual report below. You can navigate through the pages in the report by either clicking on the pages listed below, or by using the keyword search tool below to find specific information within the annual report.-
 1
1 -
2
-
3
-
4
-
5
-
6
-
7
-
8
-
9
-
10
-
11
-
12
-
13
-
14
-
15
-
16
-
17
-
18
-
19
-
20
-
21
-
22
-
23
-
24
-
25
-
26
-
27
-
28
-
29
-
30
-
31
-
32
-
33
-
34
-
35
-
36
-
37
-
38
-
 39
39 -
 40
40 -
 41
41 -
 42
42 -
 43
43 -
 44
44 -
 45
45 -
 46
46 -
 47
47 -
 48
48 -
 49
49 -
 50
50 -
 51
51 -
 52
52
 |
 |

Notes to Consolidated Financial Statements
Financial Review 2005
Darden Restaurants 57
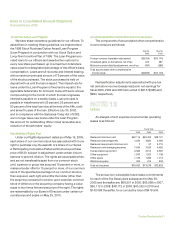
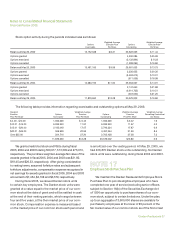
Stock option activity during the periods indicated was as follows:
Weighted-Average Weighted-Average
Options Exercise Price Options Exercise Price
Exercisable Per Share Outstanding Per Share
Balance at May 26, 2002 12,152,538 $ 8.31 26,922,535 $ 11.44
Options granted 4,200,086 $ 25.99
Options exercised (3,132,894) $ 9.23
Options cancelled (1,298,094) $ 16.86
Balance at May 25, 2003 13,481,166 $ 9.59 26,691,633 $ 13.73
Options granted 3,336,655 $ 20.36
Options exercised (3,463,615) $ 10.01
Options cancelled (911,036) $ 18.98
Balance at May 30, 2004 14,380,195 $11.00 25,653,637 $ 14.91
Options granted 2,147,650 $ 21.88
Options exercised (6,614,735) $ 10.51
Options cancelled (607,550) $ 21.20
Balance at May 29, 2005 11,879,660 $13.28 20,579,002 $ 16.86
The following table provides information regarding exercisable and outstanding options at May 29, 2005:
Range of Weighted-Average Weighted-Average Weighted-Average
Exercise Options Exercise Options Exercise Remaining Contractual
Price Per Share Exercisable Price Per Share Outstanding Price Per Share Life (Years)
$ 4.00 - $10.00 1,696,626 $ 6.42 1,696,626 $ 6.42 1.9
$10.01 - $15.00 6,933,340 11.97 6,933,340 11.97 4.2
$15.01 - $20.00 2,185,049 17.07 5,746,334 17.87 6.9
$20.01 - $25.00 559,929 22.93 3,497,264 21.93 8.5
Over $25.00 504,716 27.20 2,705,438 27.28 7.3
11,879,660 $13.28 20,579,002 $16.86 5.9
We granted restricted stock and RSUs during fiscal
2005, 2004 and 2003 totaling 500,917, 513,305 and 275,610,
respectively. The per share weighted-average fair value of the
awards granted in fiscal 2005, 2004 and 2003 was $21.82,
$19.45 and $26.53, respectively. After giving consideration
to vesting terms, assumed forfeiture rates and subsequent
forfeiture adjustments, compensation expense recognized in
net earnings for awards granted in fiscal 2005, 2004 and 2003
amounted to $7,464, $4,198 and $3,579, respectively.
During fiscal 2005, we issued Darden stock units
to certain key employees. The Darden stock units were
granted at a value equal to the market price of our com-
mon stock at the date of grant and will be settled in cash
at the end of their vesting periods, which range between
four and five years, at the then market price of our com-
mon stock. Compensation expense is measured based
on the market price of our common stock each period and
is amortized over the vesting period. At May 29, 2005, we
had 436,870 Darden stock units outstanding. No Darden
stock units were outstanding during fiscal 2004 and 2003.
NOTE 17
Employee Stock Purchase Plan
We maintain the Darden Restaurants Employee Stock
Purchase Plan to provide eligible employees who have
completed one year of service (excluding senior officers
subject to Section 16(b) of the Securities Exchange Act
of 1934) an opportunity to purchase shares of our com-
mon stock, subject to certain limitations. Under the plan,
up to an aggregate of 3,600,000 shares are available for
purchase by employees at the lower of 85 percent of the
fair market value of our common stock as of the first or last