Red Lobster 2005 Annual Report Download - page 37
Download and view the complete annual report
Please find page 37 of the 2005 Red Lobster annual report below. You can navigate through the pages in the report by either clicking on the pages listed below, or by using the keyword search tool below to find specific information within the annual report.-
 1
1 -
2
-
3
-
4
-
5
-
6
-
7
-
8
-
9
-
10
-
11
-
12
-
13
-
14
-
15
-
16
-
17
-
18
-
19
-
20
-
21
-
22
-
23
-
24
-
25
-
26
-
 27
27 -
 28
28 -
 29
29 -
 30
30 -
 31
31 -
 32
32 -
 33
33 -
 34
34 -
 35
35 -
 36
36 -
 37
37 -
 38
38 -
 39
39 -
 40
40 -
 41
41 -
 42
42 -
 43
43 -
 44
44 -
 45
45 -
 46
46 -
 47
47 -
48
-
49
-
50
-
51
-
52
 |
 |

Notes to Consolidated Financial Statements
Financial Review 2005
Darden Restaurants 45
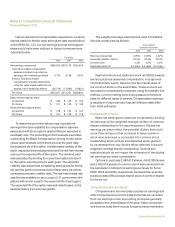
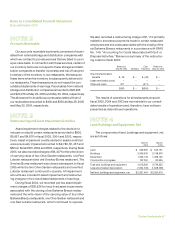
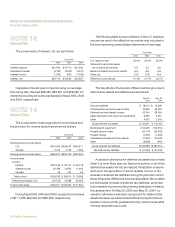
Had we determined compensation expense for our stock
options based on the fair value at the grant date as prescribed
under SFAS No. 123, our net earnings and net earnings per
share would have been reduced to the pro forma amounts
indicated below:
Fiscal Year
2005 2004 2003
Net earnings, as reported $290,606 $227,173 $225,979
Add: Stock-based compensation
expense included in reported net
earnings, net of related tax effects 5,134 3,158 2,642
Deduct: Total stock-based
compensation expense determined
under fair value based method for all
awards, net of related tax effects (22,719) (17,980) (19,801)
Pro forma $273,021 $212,351 $208,820
Basic net earnings per share
As reported $ 1.85 $ 1.39 $ 1.33
Pro forma $ 1.74 $ 1.30 $ 1.23
Diluted net earnings per share
As reported $ 1.78 $ 1.34 $ 1.27
Pro forma $ 1.67 $ 1.25 $ 1.18
To determine pro forma net earnings, reported net
earnings have been adjusted for compensation expense
associated with stock options granted that are expected to
eventually vest. The preceding pro forma results were deter-
mined using the Black Scholes option-pricing model, which
values options based on the stock price at the grant date,
the expected life of the option, the estimated volatility of the
stock, expected dividend payments and the risk-free interest
rate over the expected life of the option. The dividend yield
was calculated by dividing the current annualized dividend
by the option exercise price for each grant. The expected
volatility was determined considering stock prices for the fis-
cal year the grant occurred and prior fiscal years, as well as
considering industry volatility data. The risk-free interest rate
was the rate available on zero coupon U.S. government obli-
gations with a term equal to the expected life of each grant.
The expected life of the option was estimated based on the
exercise history from previous grants.
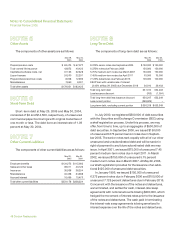
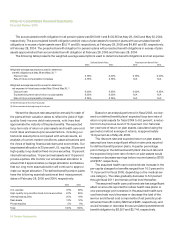
The weighted-average assumptions used in the Black
Scholes model were as follows:
Stock Options
Granted in Fiscal Year
2005 2004 2003
Risk-free interest rate 3.75% 2.62% 4.37%
Expected volatility of stock 30.0% 30.0% 30.0%
Dividend yield 0.3% 0.2% 0.2%
Expected option life 6.0 years 6.0 years 6.0 years
Restricted stock and restricted stock unit (RSU) awards
are recognized as unearned compensation, a component
of stockholders’ equity, based on the fair market value of
our common stock on the award date. These amounts are
amortized to compensation expense, using the straight-line
method, over the vesting period using assumed forfeiture
rates for different types of awards. Compensation expense
is adjusted in future periods if actual forfeiture rates differ
from initial estimates.
Net Earnings Per Share
Basic net earnings per share are computed by dividing
net earnings by the weighted-average number of common
shares outstanding for the reporting period. Diluted net
earnings per share reflect the potential dilution that could
occur if securities or other contracts to issue common
stock were exercised or converted into common stock.
Outstanding stock options and restricted stock granted
by us represent the only dilutive effect reflected in diluted
weighted-average shares outstanding. Options and
restricted stock do not impact the numerator of the diluted
net earnings per share computation.
Options to purchase 2,680,412 shares, 4,643,389 shares
and 3,952,618 shares of common stock were excluded from
the calculation of diluted net earnings per share for fiscal
2005, 2004 and 2003, respectively, because their exercise
prices exceeded the average market price of common shares
for the period.
Comprehensive Income (Loss)
Comprehensive income (loss) includes net earnings and
other comprehensive income (loss) items that are excluded
from net earnings under accounting principles generally
accepted in the United States of America. Other comprehen-
sive income (loss) items include foreign currency translation