Proctor and Gamble 2009 Annual Report Download - page 76
Download and view the complete annual report
Please find page 76 of the 2009 Proctor and Gamble annual report below. You can navigate through the pages in the report by either clicking on the pages listed below, or by using the keyword search tool below to find specific information within the annual report.-
 1
1 -
2
-
3
-
4
-
5
-
6
-
7
-
8
-
9
-
10
-
11
-
12
-
13
-
14
-
15
-
16
-
17
-
18
-
19
-
20
-
21
-
22
-
23
-
24
-
25
-
26
-
27
-
28
-
29
-
30
-
31
-
32
-
33
-
34
-
35
-
36
-
37
-
38
-
39
-
40
-
41
-
42
-
43
-
44
-
45
-
46
-
47
-
48
-
49
-
50
-
51
-
52
-
53
-
54
-
55
-
56
-
57
-
58
-
59
-
60
-
61
-
62
-
63
-
64
-
65
-
 66
66 -
 67
67 -
 68
68 -
 69
69 -
 70
70 -
 71
71 -
 72
72 -
 73
73 -
 74
74 -
 75
75 -
 76
76 -
 77
77 -
 78
78
 |
 |

74 The Procter & Gamble Company
Design: VSA Partners, Inc.
The paper utilized in the printing of this annual report is certified by SmartWood to the FSC
Standards, which promotes environmentally appropriate, socially beneficial and economically
viable management of the world’s forests. The paper contains a mix of pulp that is derived
from FSC certified well-managed forests; post-consumer recycled paper fibers and other
controlled sources.
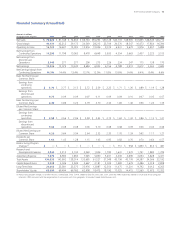
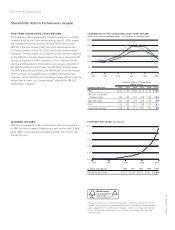
Shareholder Return Performance Graphs
FIVE-YEAR CUMULATIVE TOTAL RETURN
The following graph compares the cumulative total return of P&G’s
common stock for the 5-year period ending June 30, 2009, against
the cumulative total return of the S&P 500 Stock Index and the
S&P500 Consumer Staples Index. The graph and tables assume
$100 was invested on June 30, 2004, and that all dividends were
reinvested. The benchmark of “Composite Group” has been replaced
by the S&P500 Consumer Staples Index as the more relevant line of
business comparison to P&G’s operations. The Composite Group
results are still provided in this transition year, and are comprised of
the S&PHousehold Products Index, the S&PPaper Products Index,
the S&PPersonal Products Index, the S&P Health Care Index and the
S&PFood Index, all weighted based on P&G’s current fiscal year
revenues. Further, the Dow Jones Industrial Average will no longer be
shown after this year, as a “broad market” index as the S&P500
satisfies this comparison.
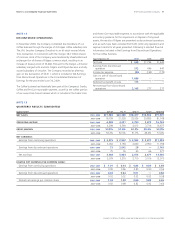
DIVIDEND HISTORY
P&G has paid dividends without interruption since its incorporation
in 1890 and has increased dividends each year for the past 53 fiscal
years. P&G’s compound annual dividend growth rate is 9.5% over
the last 53years.
19841956
0.00
0.34
0.68
1.02
1.36
1.70
2009
19981970
DIVIDENDS PER SHARE (split-adjusted)
(in dollars, split adjusted) 1956 1970 1984 1998 2009
Dividends per Share$0.01 $0.04 $0.15 $0.51 $1.64
Cumulative Value of $100 Investment,
through June 30
Company Name/Index 2004 2005 2006 2007 2008 2009
P&G $100 $99 $106 $119 $121 $105
S&P 500 Consumer
Staples Index 100 102 110 128 128 104
S&P 500 Index 100 106 115 139 121 89
DJIA 100 101 112 138 119 92
Composite Group100 99 111 131 121 99
80
90
100
110
120
130
140
P&GS&P 500 Consumer Staples Index S&P 500 Index Composite Group
2009
2008200720062004 2005
COMPARISON OF FIVE-YEAR CUMULATIVE TOTAL RETURN