Proctor and Gamble 2009 Annual Report Download - page 12
Download and view the complete annual report
Please find page 12 of the 2009 Proctor and Gamble annual report below. You can navigate through the pages in the report by either clicking on the pages listed below, or by using the keyword search tool below to find specific information within the annual report.-
 1
1 -
 2
2 -
 3
3 -
 4
4 -
 5
5 -
 6
6 -
 7
7 -
 8
8 -
 9
9 -
 10
10 -
 11
11 -
 12
12 -
 13
13 -
 14
14 -
 15
15 -
 16
16 -
 17
17 -
 18
18 -
 19
19 -
 20
20 -
 21
21 -
 22
22 -
23
-
24
-
25
-
26
-
27
-
28
-
29
-
30
-
31
-
32
-
33
-
34
-
35
-
36
-
37
-
38
-
39
-
40
-
41
-
42
-
43
-
44
-
45
-
46
-
47
-
48
-
49
-
50
-
51
-
52
-
53
-
54
-
55
-
56
-
57
-
58
-
59
-
60
-
61
-
62
-
63
-
64
-
65
-
66
-
67
-
68
-
69
-
70
-
71
-
72
-
73
-
74
-
75
-
76
-
77
-
78
 |
 |

P&G Brands
—
Designed to Be Leaders
“P&G’s billion-dollar brands are platforms for innovation. They are
global leaders. Consumers want them in their homes. Retailers
want them in their stores. They enable us to bring innovation to
consumers around the world effectively, efficiently and profitably.
They make consumers’ lives a little better, every day.”
–A.G. Lafley
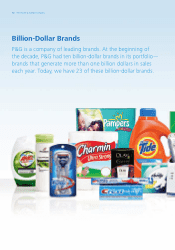
A Company of Leading Brands
For nearly 172 years, P&G has been providing trusted
brands that make every day a little better for the world’s
consumers. P&G has the largest lineup of leading brands in
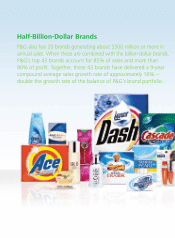
its industry, with 23 brands with over $1billion in annual
sales, and another 20 brands generating about $500million
or more in annual sales. These 43 brands have delivered a
9-year compound average sales growth rate of approximately
10%
—
double the growth rate of the balance of P&G’s
brand portfolio.
Highly Valued Assets
P&G’s market capitalization of roughly $150billion far
exceeds the $46billion book value of the Company’s
tangible assets, such as cash, machinery, buildings, etc.
The difference is the value P&G shareholders place on the
Company’s brands, the earnings and cash these brands
generate today, and the confidence that these leading
brands will continue to grow in the future.
Capabilities Designed to Grow Brands
for Decades
We have built these valuable assets with the industry-leading
levels of investment and capabilities necessary to build
brands that live and grow for decades.
Consumer Understanding
—
Over the last decade, we have
invested more than $2billion in consumer research to better
understand, anticipate and respond to consumer needs and
wants. Deep consumer understanding is a key enabler for
product innovation, packaging development and marketing
communication that create sustainable competitive advantages
for P&G brands and create superior value for consumers.
Innovation
—
Each year, we invest more than $2billion in
innovation. We complement this in-house capability with
our Connect and Develop program, which creates external
partnerships that enhance and accelerate innovation. This is
important because innovation improves consumer value and
leads to profitable market
share growth for our brands.
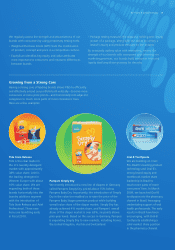
Each year IRI, a leading market
research firm, publishes its
New Product Pacesetter
Report. This U.S.-based study
ranks the most successful
new consumer packaged
goods (CPG) products, as measured by sales, over the past
year. In 2008, P&G had five of the top 10 new non-food
product launches in the U.S. and 10 of the top 25. Over
the past 14 years, P&G has had 114 top-25 IRI non-food
Pacesetters
—
more than our six largest competitors combined.
Brand Building
—
We invest more than $7billion in
advertising annually, consistently making P&G one of the
world’s largest advertisers. While the scale of our marketing
investment is significant, the messages we convey to
consumers are truly most important. These messages build
confidence that our brands will deliver on their promises
and build leading brand equities that last for generations.
P&G brands are
market leaders in
15 of the 21 major
global product
categories in which
we compete.
P&G’s top 43 brands
account for 85%
of sales and more
than 90% of profit.
90%
profit
85%
sales
10 The Procter & Gamble Company