Proctor and Gamble 2009 Annual Report Download - page 4
Download and view the complete annual report
Please find page 4 of the 2009 Proctor and Gamble annual report below. You can navigate through the pages in the report by either clicking on the pages listed below, or by using the keyword search tool below to find specific information within the annual report.-
 1
1 -
 2
2 -
 3
3 -
 4
4 -
 5
5 -
 6
6 -
 7
7 -
 8
8 -
 9
9 -
 10
10 -
 11
11 -
 12
12 -
 13
13 -
 14
14 -
 15
15 -
16
-
17
-
18
-
19
-
20
-
21
-
22
-
23
-
24
-
25
-
26
-
27
-
28
-
29
-
30
-
31
-
32
-
33
-
34
-
35
-
36
-
37
-
38
-
39
-
40
-
41
-
42
-
43
-
44
-
45
-
46
-
47
-
48
-
49
-
50
-
51
-
52
-
53
-
54
-
55
-
56
-
57
-
58
-
59
-
60
-
61
-
62
-
63
-
64
-
65
-
66
-
67
-
68
-
69
-
70
-
71
-
72
-
73
-
74
-
75
-
76
-
77
-
78
 |
 |

We’ve continued to make strategic investments to generate
strong growth in future years. We are investing 4% of sales
in capital spending, including funding for new manufacturing
capacity to support future growth. Over the next five years,
we will add 20 new manufacturing facilities
—
13 of which have
already been announced. Almost all of these facilities are in
developing markets, and almost all will be multi-product-
category facilities. By migrating our manufacturing base closer
to the consumers we’ll be serving, P&G will lower costs and
enable better value for more consumers.
We delivered results in fiscal 2009 that reflect these choices.
We delivered organic sales and EPS growth and maintained
operating margin while delivering strong free cash flow
—
the
financial lifeblood of the business.
Overall, our choices balanced short-term returns and long-term
investments.
ōOrganic sales increased 2%. Net sales declined 3%,
to $79billion.
ōCore earnings per share increased 8%. Excluding the negative
foreign exchange impact, core earnings per share would have
increased strong double digits. Diluted net earnings per share
increased 17% for the fiscal year.
ōWe delivered strong free cash flow productivity at more
than 100% of earnings, excluding the gain from the Folgers
divestiture.
And, we increased our quarterly dividend 10% in a year
when many large companies reduced or eliminated dividends.
Fiscal 2009 marked the 53rd consecutive year in which P&G
increased dividends.
DESIGNED TO LEAD
It’s too early to tell what the economic future holds. We must
deal with what’s in front of us. We must be agile and flexible.
We must stay financially strong so we can respond and continue
to lead. If the recession continues longer than expected, we must
be prepared to deal with that reality. If economies recover faster
than anticipated, we must be equally prepared to take advantage
of new growth opportunities.
P&G is well-positioned to do this. We’ve designed P&G to
lead with:
ōClear strategies
ōThe core strengths required to win in our industry
ōRigorous cash and cost discipline
ōThe most diverse and experienced leadership team in
the Company’s history
STRATEGY FOR GROWTH
Three strategic choices drove virtually all of P&G’s top-line,
bottom-line, and shareholder growth this decade.
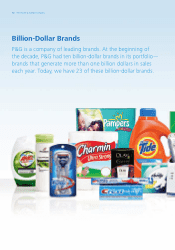
Our first choice was to focus on P&G’s core businesses and
leading billion-dollar brands, to win with the biggest and
strongest retail customers, and to win in the most important
countries. We’ve done that.
Nearly 80% of P&G’s sales and profit growth this decade has
come from 10 businesses, including Baby Care, Blades and
Razors, Fabric Care, Family Care, Feminine Care, Home Care,
Oral Care, Prestige Fragrances, Retail Hair Care and Skin Care.
About 75% of sales and profit growth has come from P&G’s
leading billion-dollar brands.
We chose to shift our business portfolio to more Beauty and
Personal Care businesses. We’ve done that. The percentage of
P&G sales in more capital-intensive Paper and Food businesses
went from 42% at the beginning of the decade to 25%. At the
same time, the percentage of sales in more asset-efficient,
faster-growing, higher-margin businesses has increased from
18% to 33% over the same period.
Beauty, Personal Care and Health Care have accounted for more
than 60% of sales and profit growth in the past eight years.
Our third strategic choice was to extend the availability and
affordability of P&G brands to more low-income consumers,
particularly in developing markets. We’ve done that. Developing
markets represent 32% of sales, up from about 20% at the
beginning of the decade, and have contributed 42% of sales
growth and 29% of profit growth.
On an aggregate basis, P&G has a 19% share in developing
markets and is growing steadily by about half a share point a
year. We now have a developing-market business which, at
about $25billion in annual sales, is over five times the average
developing-market sales of our major competitors.
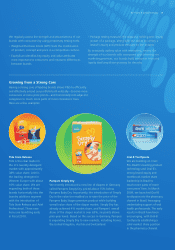
With these three strategies, P&G has delivered strong growth
over the past decade. We’ve more than doubled sales, from
$38billion to $79billion. We’ve delivered core earnings-per-share
growth of 12%, on average, since 2001. And we’ve generated
about $70billion in free cash flow.
CORE STRENGTHS TO WIN
In addition to clear where-to-play strategies, we have chosen
to focus on five core strengths that are required to win in the
consumer products industry: consumer understanding, brand-
building, innovation, go-to-market capability, and scale.
P&G is designed to lead in each of these areas.
Note: An explanation and reconciliation of organic sales and free cash flow for 2009 are
provided on page 48. Explanations of core earnings per share and free cash flow productivity
are provided in footnotes (2), (3) and (4) of the P&G Report Card on page 3.
2The Procter & Gamble Company