Proctor and Gamble 2009 Annual Report Download - page 40
Download and view the complete annual report
Please find page 40 of the 2009 Proctor and Gamble annual report below. You can navigate through the pages in the report by either clicking on the pages listed below, or by using the keyword search tool below to find specific information within the annual report.-
 1
1 -
2
-
3
-
4
-
5
-
6
-
7
-
8
-
9
-
10
-
11
-
12
-
13
-
14
-
15
-
16
-
17
-
18
-
19
-
20
-
21
-
22
-
23
-
24
-
25
-
26
-
27
-
28
-
29
-
 30
30 -
 31
31 -
 32
32 -
 33
33 -
 34
34 -
 35
35 -
 36
36 -
 37
37 -
 38
38 -
 39
39 -
 40
40 -
 41
41 -
 42
42 -
 43
43 -
 44
44 -
 45
45 -
 46
46 -
 47
47 -
 48
48 -
 49
49 -
 50
50 -
51
-
52
-
53
-
54
-
55
-
56
-
57
-
58
-
59
-
60
-
61
-
62
-
63
-
64
-
65
-
66
-
67
-
68
-
69
-
70
-
71
-
72
-
73
-
74
-
75
-
76
-
77
-
78
 |
 |

38 The Procter & Gamble Company Management’s Discussion and Analysis
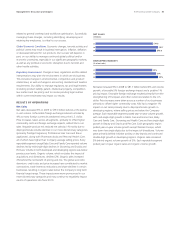
Beauty
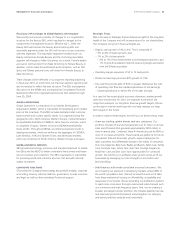
BEAUTY
($ millions) 2009
Change vs.
Prior Year 2008
Change vs.
Prior Year
Volume n/a -2% n/a +2%
Net sales $18,789 -4% $19,515 +9%
Net earnings $2,531 -7% $2,730 +5%
Beauty net sales decreased 4% in 2009 to $18.8billion on a 2%
decline in unit volume. Price increases to offset higher commodity costs
added 2% to net sales. Unfavorable foreign exchange reduced net
sales by 4%. Organic sales increased 1% versus the prior year behind
price increases, partially offset by a 1% decline in organic volume.
Volume in developed regions declined mid-single digits, while volume
in developing regions grew low single digits. Retail Hair Care volume
grew low single digits behind growth of Pantene, Head & Shoulders
and Rejoice. Prestige Fragrances volume declined high single digits
and Professional Hair Care volume declined mid-single digits mainly
due to market contractions and trade inventory reductions. Volume
in Skin Care declined mid-single digits primarily due to competitive
activity affecting shipments of Olay and the divestiture of Noxzema.
Personal Cleansing volume was down high single digits behind trade
inventory reductions, market contractions and divestiture activity. Our
market shares in key categories within Beauty were generally consistent
with the prior year.
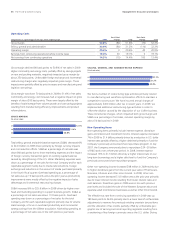
Net earnings decreased 7% in 2009 to $2.5billion mainly due to lower
net sales and reduced net earnings margin. Net earnings margin
contracted 50 basis points due to reduced gross margin and a higher
effective tax rate, partially offset by reduced SG&A as a percentage
of net sales. Gross margin declined due to higher commodity costs,
which were only partially offset by price increases and manufacturing
cost savings. SG&A was down due to lower marketing spending as a
percentage of net sales.
Beauty net sales increased 9% in 2008 to $19.5billion behind 2%
volume growth and 6% of favorable foreign exchange. Favorable
product mix had a positive 1% impact on net sales primarily due to
stronger growth in Skin Care and Prestige Fragrances, which have
higher than segment average unit selling prices. This more than offset
the impact of disproportionate growth in developing regions, which
have lower selling prices than the segment average. Skin Care volume
was up mid-single digits driven by growth of Olay behind the Definity
and Regenerist initiatives. Our global skin care market share was up
slightly, driven primarily by about a 1 point increase in our U.S. market
share. Prestige Fragrances volume was up low single digits and organic
volume was up high single digits behind new product launches on
Dolce & Gabbana and Hugo Boss. Retail Hair Care volume was up mid-
single digits, led by high single-digit growth in developing markets.
Retail Hair Care volume in developed regions was flat as a double-digit
volume increase of Head & Shoulders was offset by a double-digit
volume decline of Pantene in North America. Professional Hair Care
volume declined mid-single digits as growth from color was more than
offset by declines in care and styling. Overall, global hair care market
share was in line with the prior year level. Net earnings in Beauty
increased 5% to $2.7billion in 2008 as the impact of higher net sales
was partially offset by a lower net earnings margin. Net earnings margin
was down 60 basis points as lower gross margin and the impact of
base period divestiture gains on minor brands more than offset the
benefit of a lower tax rate due to geographic mix. Gross margin was
down due to higher commodity costs, which more than offset the
benefit of increased volume scale leverage and manufacturing cost
savings projects. SG&A increased slightly as higher marketing spending
as a percentage of net sales was partially offset by lower overhead
spending as a percentage of net sales.
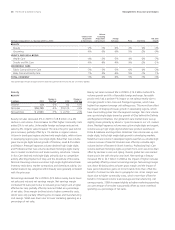
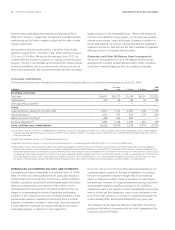
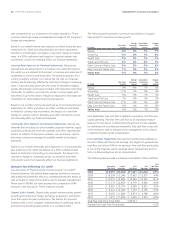
Net Sales Change Drivers vs. Year Ago (2009 vs. 2008)
Volume with
Acquisitions
& Divestitures
Volume
Excluding
Acquisitions
& Divestitures
Foreign
Exchange Price Mix/Other
Net Sales
Growth
BEAUTY
Beauty -2% -1% -4% 2% 0% -4%
Grooming -6% -5% -6% 5% -2% -9%
HEALTH AND WELL-BEING
Health Care-4% -3% -5% 4% -2% -7%
Snacks and Pet Care-6% -6% -4% 9% -2% -3%
HOUSEHOLD CARE
Fabric Care and Home Care-3% -3% -5% 6% 0% -2%
Baby Care and Family Care1% 2% -4% 5% -1% 1%
TOTAL COMPANY -3% -2% -4% 5% -1% -3%
Sales percentage changes are approximations based on quantitative formulas that are consistently applied.