Proctor and Gamble 2009 Annual Report Download - page 45
Download and view the complete annual report
Please find page 45 of the 2009 Proctor and Gamble annual report below. You can navigate through the pages in the report by either clicking on the pages listed below, or by using the keyword search tool below to find specific information within the annual report.-
 1
1 -
2
-
3
-
4
-
5
-
6
-
7
-
8
-
9
-
10
-
11
-
12
-
13
-
14
-
15
-
16
-
17
-
18
-
19
-
20
-
21
-
22
-
23
-
24
-
25
-
26
-
27
-
28
-
29
-
30
-
31
-
32
-
33
-
34
-
 35
35 -
 36
36 -
 37
37 -
 38
38 -
 39
39 -
 40
40 -
 41
41 -
 42
42 -
 43
43 -
 44
44 -
 45
45 -
 46
46 -
 47
47 -
 48
48 -
 49
49 -
 50
50 -
 51
51 -
 52
52 -
 53
53 -
 54
54 -
 55
55 -
56
-
57
-
58
-
59
-
60
-
61
-
62
-
63
-
64
-
65
-
66
-
67
-
68
-
69
-
70
-
71
-
72
-
73
-
74
-
75
-
76
-
77
-
78
 |
 |

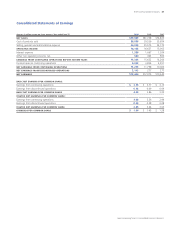
Management’s Discussion and Analysis The Procter & Gamble Company 43
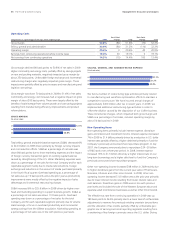
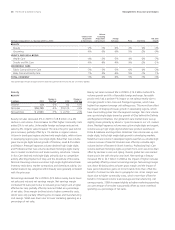
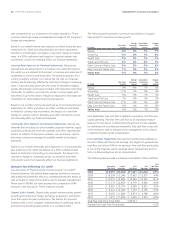
below our 90% target primarily due to the gain on the Folgers coffee
transaction which lowered productivity by approximately 15% because
the gain is included in net earnings but had no impact on operating
cash flow.
In 2008, free cash flow was $12.0billion, compared to $10.5billion
in 2007. Free cash flow increased primarily as a result of higher
operating cash flow. Capital expenditures were $3.0billion and 3.7%
of net sales. Free cash flow productivity was 99% in 2008, ahead of
our 90% target.
Target %
%
87%
%
07
09
08
FREE CASH FLOW PRODUCTIVITY
(% of net earnings)
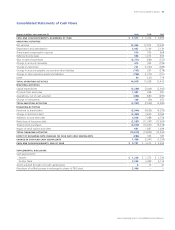
Investing Activities
Net investing activities used $2.4billion of cash in 2009 and $2.5billion
in 2008 mainly due to capital spending.
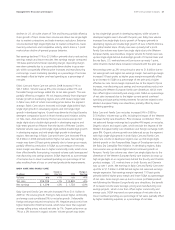
Capital Spending. We view capital spending efficiency as a critical
component of our overall cash management strategy. Capital
expenditures in 2009 were $3.2billion, compared to $3.0billion in
2008. Capital spending as a percentage of net sales was 4.1% in 2009,
compared to 3.7% in 2008, as we continued to make investments to
support capacity, innovation and cost savings. Capital spending for
our discontinued Coffee business was $3million and $30million in
2009 and 2008, respectively.
3.9%
4.%
3.7%
07
09
08
CAPITAL SPENDING
(% of net sales)
Acquisitions. Acquisitions used $368million of cash in 2009 primarily
for the acquisition of Nioxin, a leader in the scalp care professional
hair care market, which was incorporated into Beauty. In 2008,
acquisitions used $381million of cash primarily for the acquisition of
Frederic Fekkai, a premium hair care brand, in Beauty.
Proceeds from Asset Sales. Proceeds from asset sales were
$1.1billion in 2009 mainly due to the sale of our Coffee business
and the Thermacare brand. Of these proceeds, $350million related
to debt issued in connection with the Folgers coffee transaction.
The underlying debt obligation was transferred to The J.M. Smucker
Company pursuant to the transaction. No cash was received from
Smucker in the exchange transaction. During 2009, we also divested
our Thermacare brand and a number of other minor brands. In 2008,
proceeds from asset sales were $928million primarily behind the sale
of our Western Europe family care business as well as several minor
Beauty and Health Care divestitures.
Financing Activities
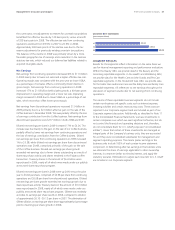
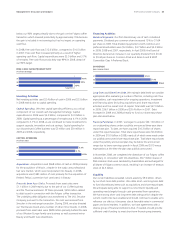
Dividend Payments. Our first discretionary use of cash is dividend
payments. Dividends per common share increased 13% to $1.64
per share in 2009. Total dividend payments to both common and
preferred shareholders were $5.0billion, $4.7billion and $4.2billion
in 2009, 2008 and 2007, respectively. In April 2009, the Board of
Directors declared an increase in our quarterly dividend from $0.40
to $0.44 per share on Common Stock and Series A and B ESOP
Convertible Class A Preferred Stock.
$1.28
$.64
$1.45
07
09
08
DIVIDENDS
(per common share)
Long-Term and Short-Term Debt. We maintain debt levels we consider
appropriate after evaluating a number of factors, including cash flow
expectations, cash requirements for ongoing operations, investment
and financing plans (including acquisitions and share repurchase
activities) and the overall cost of capital. Total debt was $37.0billion
in 2009, $36.7billion in 2008 and $35.4billion in 2007. Debt
increased in 2009 and 2008 primarily to fund our share repurchase
plan discussed below.
Treasury Purchases. In 2007, we began to acquire $24–30billion of
our outstanding shares under a publicly announced three-year share
repurchase plan. To date, we have acquired $16.3billion of shares
under this repurchase plan. Total share repurchases were $6.4billion
in 2009 and $10.0billion in 2008, nearly all of which were made under
our publicly announced share repurchase plan. Total share repurchases
under the publicly announced plan may be below the announced
range due to lower earnings growth in fiscal 2009 and 2010 versus
expectations at the time the plan was publicly announced.
In November 2008, we completed the divestiture of our Folgers coffee
subsidiary. In connection with this divestiture, 38.7 million shares of
P&G common stock were tendered by shareholders and exchanged for
all shares of Folgers common stock, resulting in an increase of treasury
stock of $2.5 billion.
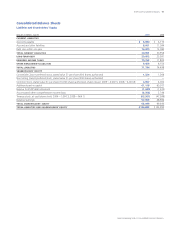
Liquidity
Our current liabilities exceeded current assets by $9.0billion, driven
by our short-term debt position. We utilize short- and long-term debt
to fund discretionary items such as acquisitions and share repurchases.
We anticipate being able to support our short-term liquidity and
operating needs largely through cash generated from operations.
We have strong short- and long-term debt ratings which despite the
current credit crisis have enabled and should continue to enable us to
refinance our debt as it becomes due at favorable rates in commercial
paper and bond markets. In addition, we have agreements with a
diverse group of financial institutions that, if needed, should provide
sufficient credit funding to meet short-term financing requirements.