Proctor and Gamble 2009 Annual Report Download - page 37
Download and view the complete annual report
Please find page 37 of the 2009 Proctor and Gamble annual report below. You can navigate through the pages in the report by either clicking on the pages listed below, or by using the keyword search tool below to find specific information within the annual report.-
 1
1 -
2
-
3
-
4
-
5
-
6
-
7
-
8
-
9
-
10
-
11
-
12
-
13
-
14
-
15
-
16
-
17
-
18
-
19
-
20
-
21
-
22
-
23
-
24
-
25
-
26
-
 27
27 -
 28
28 -
 29
29 -
 30
30 -
 31
31 -
 32
32 -
 33
33 -
 34
34 -
 35
35 -
 36
36 -
 37
37 -
 38
38 -
 39
39 -
 40
40 -
 41
41 -
 42
42 -
 43
43 -
 44
44 -
 45
45 -
 46
46 -
 47
47 -
48
-
49
-
50
-
51
-
52
-
53
-
54
-
55
-
56
-
57
-
58
-
59
-
60
-
61
-
62
-
63
-
64
-
65
-
66
-
67
-
68
-
69
-
70
-
71
-
72
-
73
-
74
-
75
-
76
-
77
-
78
 |
 |

Management’s Discussion and Analysis The Procter & Gamble Company 35
related to general overhead and workforce optimization. Successfully
managing these changes, including identifying, developing and
retaining key employees, is critical to our success.
Global Economic Conditions. Economic changes, terrorist activity and
political unrest may result in business interruption, inflation, deflation
or decreased demand for our products. Our success will depend, in
part, on our ability to manage continued global political and/or
economic uncertainty, especially in our significant geographic markets,
as well as any political or economic disruption due to terrorist and
other hostile activities.
Regulatory Environment. Changes in laws, regulations and the related
interpretations may alter the environment in which we do business.
This includes changes in environmental, competitive and product-
related laws, as well as changes in accounting standards and taxation
requirements. Our ability to manage regulatory, tax and legal matters
(including product liability, patent, intellectual property, competition
law matters and tax policy) and to resolve pending legal matters
within current estimates may impact our results.
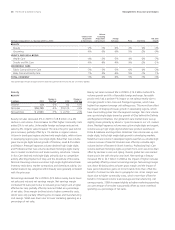
RESULTS OF OPERATIONS
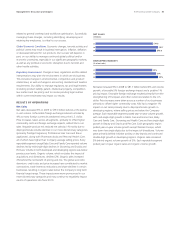
Net Sales
Net sales decreased 3% in 2009 to $79.0billion behind a 3% decline
in unit volume. Unfavorable foreign exchange reduced net sales by
4% as many foreign currencies weakened versus the U.S. dollar.
Price increases, taken across all segments, primarily to offset higher
commodity costs and foreign exchange impacts, added 5% to net
sales. Negative product mix reduced net sales by 1% mainly due to
disproportionate volume declines in our more discretionary categories
(primarily Prestige Fragrances, Professional Hair Care and Braun
appliances), along with Pharmaceuticals and Personal Health Care,
all of which have higher than Company average selling prices. Every
reportable segment except Baby Care and Family Care reported volume
declines led by mid-single-digit declines in Grooming and Snacks and
Pet Care. Volume in both developed and developing regions was below
previous year levels. Organic volume, which excludes the impact of
acquisitions and divestitures, declined 2%. Organic sales increased
2% behind the net benefit of pricing and mix. The global economic
downturn, credit crisis and price increases have contributed to market
contractions, trade inventory reductions and share declines in certain
businesses, resulting in organic sales below the Company’s long-term
financial target range. These impacts were more pronounced in our
more discretionary categories and may continue to negatively impact
results of operations into fiscal 2010.
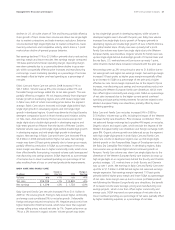
$.
$9.0
$.
07
09
08
NET SALES
($ billions)
29%
32%
31%
07
09
08
DEVELOPING MARKETS
(% of net sales)
Net sales increased 9% in 2008 to $81.7billion behind 4% unit volume
growth, a favorable 5% foreign exchange impact and a positive 1%
pricing impact. Favorable foreign exchange resulted primarily from the
strengthening of European and other currencies relative to the U.S.
dollar. Price increases were taken across a number of our businesses
primarily to offset higher commodity costs. Mix had a negative 1%
impact on net sales primarily due to disproportionate growth in
developing regions, where selling prices are below the Company
average. Each reportable segment posted year-on-year volume growth,
with mid-single-digit growth in Fabric Care and Home Care, Baby
Care and Family Care, Grooming and Health Care and low single-digit
growth in Beauty and Snacks and Pet Care. Each geographic region
posted year-on-year volume growth except Western Europe, which
was down low single digits due to the impact of divestitures. Volume
grew primarily behind initiative activity on key brands and continued
double-digit growth in developing regions. Organic sales increased
5% behind organic volume growth of 5%. Each reportable segment
posted year-on-year organic sales and organic volume growth.