Proctor and Gamble 2009 Annual Report Download - page 75
Download and view the complete annual report
Please find page 75 of the 2009 Proctor and Gamble annual report below. You can navigate through the pages in the report by either clicking on the pages listed below, or by using the keyword search tool below to find specific information within the annual report.-
 1
1 -
2
-
3
-
4
-
5
-
6
-
7
-
8
-
9
-
10
-
11
-
12
-
13
-
14
-
15
-
16
-
17
-
18
-
19
-
20
-
21
-
22
-
23
-
24
-
25
-
26
-
27
-
28
-
29
-
30
-
31
-
32
-
33
-
34
-
35
-
36
-
37
-
38
-
39
-
40
-
41
-
42
-
43
-
44
-
45
-
46
-
47
-
48
-
49
-
50
-
51
-
52
-
53
-
54
-
55
-
56
-
57
-
58
-
59
-
60
-
61
-
62
-
63
-
64
-
 65
65 -
 66
66 -
 67
67 -
 68
68 -
 69
69 -
 70
70 -
 71
71 -
 72
72 -
 73
73 -
 74
74 -
 75
75 -
 76
76 -
 77
77 -
 78
78
 |
 |

The Procter & Gamble Company 73
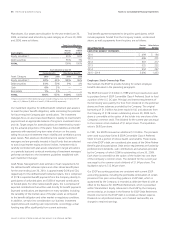
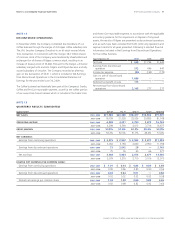
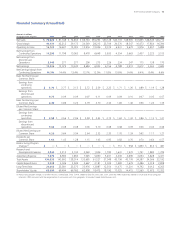
Financial Summary(Unaudited)
Amounts in millions,
except per share amounts 2009 2008 2007 2006 2005 2004 2003 2002 2001 2000 1999
Net Sales $ 79,029 $81,748 $74,832 $66,724 $55,292 $50,128 $42,133 $38,965 $37,855 $38,545 $36,710
Gross Margin 40,131 42,212 39,173 34,549 28,213 25,709 20,570 18,547 16,473 17,854 16,394
Operating Income 16,123 16,637 15,003 12,916 10,026 9,019 6,931 5,672 3,976 5,457 5,885
Net Earnings from
Continuing Operations 11,293 11,798 10,063 8,478 6,648 5,930 4,554 3,663 2,437 3,225 3,513
Net Earnings from
Discontinued
Operations 2,143 277 277 206 275 226 234 247 175 138 170
Net Earnings 13,436 12,075 10,340 8,684 6,923 6,156 4,788 3,910 2,612 3,363 3,683
Net Earnings Margin from
Continuing Operations 14.3% 14.4% 13.4% 12.7% 12.0% 11.8% 10.8% 9.4% 6.4% 8.4% 9.6%
Basic Net Earnings per
Common Share:
Earnings from
continuing
operations $3.76 $ 3.77 $ 3.13 $ 2.72 $ 2.59 $ 2.25 $ 1.71 $ 1.36 $ 0.89 $ 1.19 $ 1.28
Earnings from
discontinued
operations 0.73 0.09 0.09 0.07 0.11 0.09 0.09 0.10 0.07 0.05 0.07
Basic Net Earnings per
Common Share 4.49 3.86 3.22 2.79 2.70 2.34 1.80 1.46 0.96 1.24 1.35
Diluted Net Earnings
per Common Share:
Earnings from
continuing
operations $3.58 $ 3.56 $ 2.96 $ 2.58 $ 2.43 $ 2.12 $ 1.62 $ 1.30 $ 0.86 $ 1.13 $ 1.21
Earnings from
discontinued
operations 0.68 0.08 0.08 0.06 0.10 0.08 0.08 0.09 0.06 0.04 0.06
Diluted Net Earnings per
Common Share 4.26 3.64 3.04 2.64 2.53 2.20 1.70 1.39 0.92 1.17 1.27
Dividends per
Common Share 1.64 1.45 1.28 1.15 1.03 0.93 0.82 0.76 0.70 0.64 0.57
Restructuring Program
Charges(1) $
—
$
—
$
—
$
—
$
—
$
—
$751 $958 $1,850 $814 $481
Research and
Development Expense 2,044 2,212 2,100 2,060 1,926 1,782 1,641 1,572 1,751 1,880 1,709
Advertising Expense 7,579 8,583 7,850 7,045 5,850 5,401 4,406 3,696 3,654 3,828 3,471
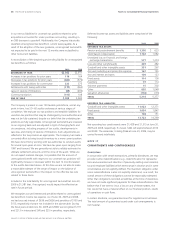
Total Assets 134,833 143,992 138,014 135,695 61,527 57,048 43,706 40,776 34,387 34,366 32,192
Capital Expenditures 3,238 3,046 2,945 2,667 2,181 2,024 1,482 1,679 2,486 3,018 2,828
Long-Term Debt 20,652 23,581 23,375 35,976 12,887 12,554 11,475 11,201 9,792 9,012 6,265
Shareholders’ Equity 63,099 69,494 66,760 62,908 18,475 18,190 17,025 14,415 12,560 12,673 12,352
(1) Restructuring program charges, on an after-tax basis, totaled $538, $706, $1,475, $688 and $285 for 2003, 2002, 2001, 2000 and 1999, respectively, related to a multi-year restructuring plan
initiated in 1999 concurrent with the reorganization of our business units from geographic into product-based Global Business Units.