Proctor and Gamble 2009 Annual Report Download - page 2
Download and view the complete annual report
Please find page 2 of the 2009 Proctor and Gamble annual report below. You can navigate through the pages in the report by either clicking on the pages listed below, or by using the keyword search tool below to find specific information within the annual report.-
 1
1 -
 2
2 -
 3
3 -
 4
4 -
 5
5 -
 6
6 -
 7
7 -
 8
8 -
 9
9 -
 10
10 -
 11
11 -
 12
12 -
 13
13 -
14
-
15
-
16
-
17
-
18
-
19
-
20
-
21
-
22
-
23
-
24
-
25
-
26
-
27
-
28
-
29
-
30
-
31
-
32
-
33
-
34
-
35
-
36
-
37
-
38
-
39
-
40
-
41
-
42
-
43
-
44
-
45
-
46
-
47
-
48
-
49
-
50
-
51
-
52
-
53
-
54
-
55
-
56
-
57
-
58
-
59
-
60
-
61
-
62
-
63
-
64
-
65
-
66
-
67
-
68
-
69
-
70
-
71
-
72
-
73
-
74
-
75
-
76
-
77
-
78
 |
 |

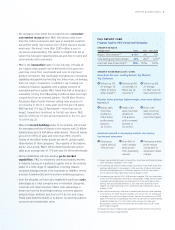
Financial Highlights
FINANCIAL SUMMARY (UNAUDITED)
Amounts in millions, except per share amounts 2009 2008 2007 2006 2005
Net Sales $79,029 $81,748 $74,832 $66,724 $55,292
Operating Income 16,123 16,637 15,003 12,916 10,026
Net Earnings 13,436 12,075 10,340 8,684 6,923
Net Earnings Margin from Continuing Operations 14.3% 14.4% 13.4% 12.7% 12.0%
Diluted Net Earnings per Common Share from Continuing Operations $ 3.58 $ 3.56 $ 2.96 $ 2.58 $ 2.43
4.26 3.64 3.04 2.64 2.53
1.64 1.45 1.28 1.15 1.03
Contents
1
5
8
10
12
16
18
24
25
26
27
72
73
NET SALES
(in billions of dollars)
$55.3
$79.0
$66.7
$74.8
$81.7
05
06
07
09
08
OPERATING CASH FLOW
(in billions of dollars)
$8.6
$14.9
$11.4
$13.4
$15.0
05
06
07
09
08
DILUTED NET EARNINGS
(per common share)
$2.53
$4.26
$2.64
$3.04
$3.64
05
06
07
09
08
Note: Previous period results have been amended to exclude the results of the Folgers coffee
business from continuing operations. For more information refer to Note 12 on page 71.
Diluted Net Earnings per Common Share
Dividends per Common Share
A.G. Lafley Letter to Shareholders
Bob McDonald Letter to Shareholders
Touching Lives
P&G Brands
—
Designed to Be Leaders
Improving Life
Corporate Officers
Board of Directors
P&G at a Glance
Financial Contents
Shareholder Information
11-Year Financial Summary
P&G Leaders
—
Built from Within
Billion- and Half-Billion Dollar Brands