Proctor and Gamble 2009 Annual Report Download - page 44
Download and view the complete annual report
Please find page 44 of the 2009 Proctor and Gamble annual report below. You can navigate through the pages in the report by either clicking on the pages listed below, or by using the keyword search tool below to find specific information within the annual report.-
 1
1 -
2
-
3
-
4
-
5
-
6
-
7
-
8
-
9
-
10
-
11
-
12
-
13
-
14
-
15
-
16
-
17
-
18
-
19
-
20
-
21
-
22
-
23
-
24
-
25
-
26
-
27
-
28
-
29
-
30
-
31
-
32
-
33
-
 34
34 -
 35
35 -
 36
36 -
 37
37 -
 38
38 -
 39
39 -
 40
40 -
 41
41 -
 42
42 -
 43
43 -
 44
44 -
 45
45 -
 46
46 -
 47
47 -
 48
48 -
 49
49 -
 50
50 -
 51
51 -
 52
52 -
 53
53 -
 54
54 -
55
-
56
-
57
-
58
-
59
-
60
-
61
-
62
-
63
-
64
-
65
-
66
-
67
-
68
-
69
-
70
-
71
-
72
-
73
-
74
-
75
-
76
-
77
-
78
 |
 |
42 The Procter & Gamble Company Management’s Discussion and Analysis
Corporate
Corporate includes certain operating and non-operating activities not
allocated to specific business units. These include: the incidental
businesses managed at the corporate level; financing and investing
activities; other general corporate items; the historical results of certain
divested brands and categories; and certain restructuring-type activities
to maintain a competitive cost structure, including manufacturing
and workforce optimization. Corporate also includes reconciling items
to adjust the accounting policies used in the segments to U.S. GAAP.
The most significant reconciling items include income taxes (to adjust
from statutory rates that are reflected in the segments to the overall
Company effective tax rate), adjustments for unconsolidated entities
(to eliminate sales, cost of products sold and SG&A for entities that
are consolidated in the segments but accounted for using the
equity method for U.S. GAAP) and minority interest adjustments for
subsidiaries where we do not have 100% ownership. Since certain
unconsolidated entities and less than 100%-owned subsidiaries are
managed as integral parts of the Company, they are accounted for
similar to a wholly owned subsidiary for management and segment
purposes. This means our segment results recognize 100% of each
income statement component through before-tax earnings in the
segments, with eliminations for unconsolidated entities in Corporate.
In determining segment after-tax net earnings, we apply the statutory
tax rates (with adjustments to arrive at the Company’s effective tax
rate in Corporate) and eliminate the share of earnings applicable to
other ownership interests, in a manner similar to minority interest.
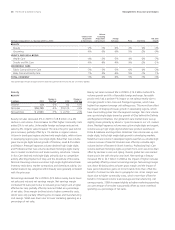
Corporate net sales primarily reflect the adjustment to eliminate the
sales of unconsolidated entities included in business segment results.
Accordingly, Corporate net sales is generally a negative balance.
Negative net sales in Corporate declined $86million in 2009 primarily
driven by lower adjustments to eliminate these sales. These adjustments
decreased due to lower net sales of existing unconsolidated entities.
Net expenses from continuing operations decreased $316million to
$201million. The decrease was primarily due to corporate hedging
impacts, lower interest expense and higher current period divestiture
gains, partially offset by higher restructuring spending. These items
are discussed in more detail in the Results of Operations section.
In 2008, negative net sales increased $474million in Corporate
primarily driven by higher adjustments to eliminate the impact of
joint venture net sales for unconsolidated entities. These adjustments
increased due to sales growth of existing unconsolidated entities and
the addition of the Swiss Precision Diagnostics business. Net expenses
in Corporate decreased $450million in 2008. The decrease was
driven primarily by a lower tax rate resulting from the net benefits of
adjustments to reserves for uncertain tax positions.
FINANCIAL CONDITION
We believe our financial condition continues to be of high quality, as
evidenced by our ability to generate substantial cash from operations
and ready access to capital markets at competitive rates.
Operating cash flow provides the primary source of funds to finance
operating needs and capital expenditures. Excess operating cash is
used first to fund shareholder dividends. Other discretionary uses
include share repurchases and “tack-on” acquisitions to complement
our portfolio of brands and geographies. As necessary, we may
supplement operating cash flow with debt to fund these activities.
The overall cash position of the Company reflects our strong business
results and a global cash management strategy that takes into account
liquidity management, economic factors and tax considerations.
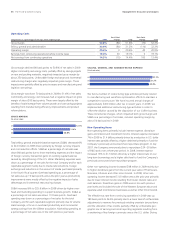
Operating Activities
Operating cash flow was $14.9billion in 2009, a decrease of 1%
versus the prior year total of $15.0billion. Operating cash flow
resulted primarily from net earnings adjusted for non-cash items
(depreciation and amortization, stock-based compensation, deferred
income taxes and gain on the sale of businesses). The combination of
net earnings and non-cash items provided $15.3billion of operating
cash as compared to $16.7billion in the prior year. The decrease in
operating cash flow versus 2008 was primarily due to a decline in net
earnings from continuing operations. A net decrease in working
capital also added to cash flow in the current year as lower accounts
receivable and inventory balances were partially offset by a decline in
accounts payable. The decrease in working capital was primarily due
to the impact of lower net sales and our ability to adequately adjust
production to better meet unit volume requirements. Accounts
receivable days declined primarily due to improved collection efforts.
Inventory and accounts payable days declined due in part to the
optimization of our manufacturing process and inventory levels and
a moderation of commodity costs late in the year. Other operating
assets and liabilities reduced cash flow primarily due to changes in
postretirement benefit plans. Cash flow from discontinued operations
contributed $124million to operating cash flow.
In 2008, operating cash flow increased 12% over the prior year to
$15.0billion. Both operating cash flow and the increase in operating
cash flow over the prior year resulted primarily from higher net
earnings and non-cash charges (depreciation and amortization,
stock-based compensation, deferred income taxes and gain on the
sale of businesses). Working capital balances increased primarily to
support business growth resulting in a net use of cash. Cash flow
from discontinued operations contributed $263million to operating
cash flow.
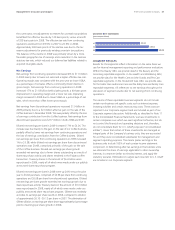
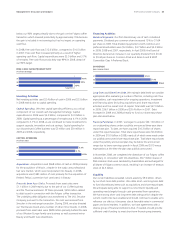
Free Cash Flow.We view free cash flow as an important measure
because it is one factor impacting the amount of cash available for
dividends and discretionary investment. It is defined as operating cash
flow less capital expenditures and is one of the measures used to
evaluate senior management and determine their at-risk compensation.
Free cash flow was $11.7billion in 2009, compared to $12.0billion in
2008. Free cash flow decreased as a result of higher capital spending
and lower operating cash flow. Free cash flow productivity, defined as
the ratio of free cash flow to net earnings, was 87% in 2009. This is