Proctor and Gamble 2009 Annual Report Download - page 16
Download and view the complete annual report
Please find page 16 of the 2009 Proctor and Gamble annual report below. You can navigate through the pages in the report by either clicking on the pages listed below, or by using the keyword search tool below to find specific information within the annual report.
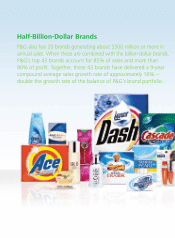
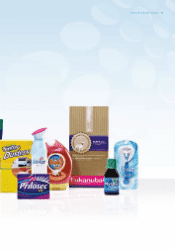
Half-Billion-Dollar Brands
P&G also has 20 brands generating about $500million or more in
annual sales. When these are combined with the billion-dollar brands,
P&G’s top 43 brands account for 85% of sales and more than
90% of profit. Together, these 43 brands have delivered a 9-year
compound average sales growth rate of approximately 10%
—
double the growth rate of the balance of P&G’s brand portfolio.


