Proctor and Gamble 2009 Annual Report Download - page 64
Download and view the complete annual report
Please find page 64 of the 2009 Proctor and Gamble annual report below. You can navigate through the pages in the report by either clicking on the pages listed below, or by using the keyword search tool below to find specific information within the annual report.-
 1
1 -
2
-
3
-
4
-
5
-
6
-
7
-
8
-
9
-
10
-
11
-
12
-
13
-
14
-
15
-
16
-
17
-
18
-
19
-
20
-
21
-
22
-
23
-
24
-
25
-
26
-
27
-
28
-
29
-
30
-
31
-
32
-
33
-
34
-
35
-
36
-
37
-
38
-
39
-
40
-
41
-
42
-
43
-
44
-
45
-
46
-
47
-
48
-
49
-
50
-
51
-
52
-
53
-
 54
54 -
 55
55 -
 56
56 -
 57
57 -
 58
58 -
 59
59 -
 60
60 -
 61
61 -
 62
62 -
 63
63 -
 64
64 -
 65
65 -
 66
66 -
 67
67 -
 68
68 -
 69
69 -
 70
70 -
 71
71 -
 72
72 -
 73
73 -
 74
74 -
75
-
76
-
77
-
78
 |
 |

62 The Procter & Gamble Company Notes to Consolidated Financial Statements
Amounts in millions of dollars except per share amounts or as otherwise specified.
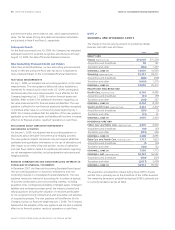
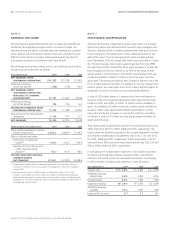
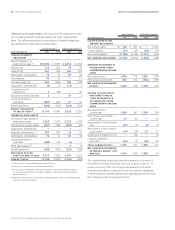
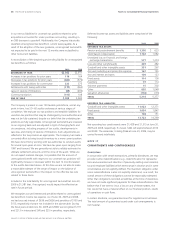
NOTE 6
EARNINGS PER SHARE
Net earnings less preferred dividends (net of related tax benefits) are
divided by the weighted average number of common shares out-
standing during the year to calculate basic net earnings per common
share. Diluted net earnings per common share are calculated to give
effect to stock options and other stock-based awards (see Note 7)
and assume conversion of preferred stock (see Note 8).
Net earnings and common shares used to calculate basic and diluted
net earnings per share were as follows:
Years ended June 30 2009 2008 2007
NET EARNINGS FROM
CONTINUING OPERATIONS $11,293 $11,798 $10,063
Preferred dividends,
net of tax benefit (192)(176)(161)
NET EARNINGS FROM
CONTINUING OPERATIONS
AVAILABLE TO COMMON
SHAREHOLDERS 11,101 11,622 9,902
Preferred dividends,
net of tax benefit 192 176 161
DILUTED NET EARNINGS FROM
CONTINUING OPERATIONS 11,293 11,798 10,063
Net earnings from discontinued
operations 2,143 277 277
NET EARNINGS 13,436 12,075 10,340
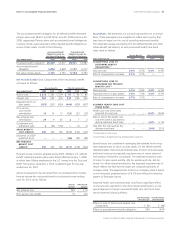
Shares in millions; Years ended June 30 2009 2008 2007
Basic weighted average common
shares outstanding 2,952.2 3,080.8 3,159.0
Effect of dilutive securities
Conversion of preferred
shares (1) 139.2 144.2 149.6
Exercise of stock options and
other unvested equity
awards (2) 62.7 91.8 90.0
DILUTED WEIGHTED AVERAGE
COMMON SHARES
OUTSTANDING 3,154.1 3,316.8 3,398.6
(1) Despite being included currently in diluted net earnings per common share, the actual
conversion to common stock occurs pursuant to the repayment of the ESOPs’ obligations
through 2035.
(2) Approximately 92 million in 2009, 40 million in 2008 and 41 million in 2007 of the
Company’s outstanding stock options were not included in the diluted net earnings per
share calculation because the options were out of the money or to do so would have been
antidilutive (i.e., the total proceeds upon exercise would have exceeded the market value of
the underlying common shares).
NOTE 7
STOCK-BASED COMPENSATION
We have stock-based compensation plans under which we annually
grant stock option and restricted stock awards to key managers and
directors. Exercise prices on options granted have been and continue
to be set equal to the market price of the underlying shares on the
date of the grant. The key manager stock option awards granted
since September2002 are vested after three years and have a 10-year
life. The key manager stock option awards granted from July1998
through August2002 vested after three years and have a 15-year life.
Key managers can elect to receive up to 50% of the value of their
option award in restricted stock units (RSUs). Key manager RSUs are
vested and settled in shares of common stock five years from the
grant date. The awards provided to the Company’s directors are in the
form of restricted stock and RSUs. In addition to our key manager and
director grants, we make other minor stock option and RSU grants to
employees for which the terms are not substantially different.
A total of 229million shares of common stock were authorized for
issuance under stock-based compensation plans approved by share-
holders in 2001 and 2003, of which 12million remain available for
grant. An additional 20million shares of common stock available for
issuance under a plan approved by Gillette shareholders in 2004
were assumed by the Company in conjunction with the acquisition
of Gillette. A total of 10million of these shares remain available for
grant under this plan.
Total stock-based compensation expense for stock option grants was
$460, $522 and $612 for 2009, 2008 and 2007, respectively. The
total income tax benefit recognized in the income statement for these
stock-based compensation arrangements was $126, $141 and $163
for 2009, 2008 and 2007, respectively. Total compensation cost for
restricted stock, RSUs and other stock-based grants, was $56, $33 and
$56 in 2009, 2008 and 2007, respectively.
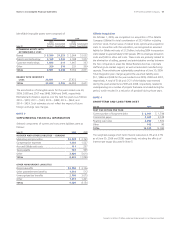
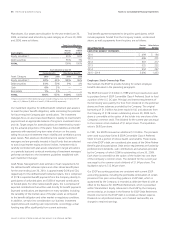
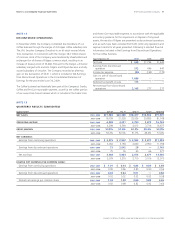
In calculating the compensation expense for stock options granted,
we utilize a binomial lattice-based valuation model. Assumptions
utilized in the model, which are evaluated and revised, as necessary,
to reflect market conditions and experience, were as follows:
Years ended June 30 2009 2008 2007
Interest rate 0.7– 3.8% 1.3 – 3.8% 4.3 –4.8%
Weighted average
interest rate 3.6% 3.4% 4.5%
Dividend yield 2.0% 1.9% 1.9%
Expected volatility 18 –34% 19 –25% 16 –20%
Weighted average
volatility 21% 20% 19%
Expected life in years 8.78.3 8.7