Proctor and Gamble 2009 Annual Report Download - page 38
Download and view the complete annual report
Please find page 38 of the 2009 Proctor and Gamble annual report below. You can navigate through the pages in the report by either clicking on the pages listed below, or by using the keyword search tool below to find specific information within the annual report.-
 1
1 -
2
-
3
-
4
-
5
-
6
-
7
-
8
-
9
-
10
-
11
-
12
-
13
-
14
-
15
-
16
-
17
-
18
-
19
-
20
-
21
-
22
-
23
-
24
-
25
-
26
-
27
-
 28
28 -
 29
29 -
 30
30 -
 31
31 -
 32
32 -
 33
33 -
 34
34 -
 35
35 -
 36
36 -
 37
37 -
 38
38 -
 39
39 -
 40
40 -
 41
41 -
 42
42 -
 43
43 -
 44
44 -
 45
45 -
 46
46 -
 47
47 -
 48
48 -
49
-
50
-
51
-
52
-
53
-
54
-
55
-
56
-
57
-
58
-
59
-
60
-
61
-
62
-
63
-
64
-
65
-
66
-
67
-
68
-
69
-
70
-
71
-
72
-
73
-
74
-
75
-
76
-
77
-
78
 |
 |
36 The Procter & Gamble Company Management’s Discussion and Analysis
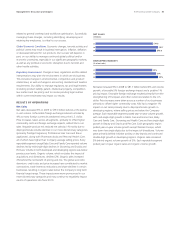
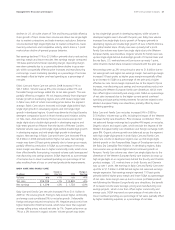
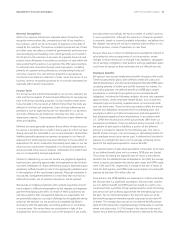
Gross margin declined 80 basis points to 50.8% of net sales in 2009.
Higher commodity and energy costs, partially offset by savings projects
on raw and packing materials, negatively impacted gross margin by
about 250 basis points. Unfavorable foreign exchange and incremental
restructuring charges also negatively impacted gross margin. These
impacts were partially offset by price increases and manufacturing and
logistics cost savings.
Gross margin was down 70 basis points in 2008 to 51.6% of net sales.
Commodity and energy cost increases had anegative impact on gross
margin of about 200 basis points. These were largely offset by the
benefits of scale leverage from volume growth and cost savings projects
resulting from manufacturing efficiency improvements and product
reformulations.
52.3%
50.8%
51.6%
07
09
08
GROSS MARGIN
(% of net sales)
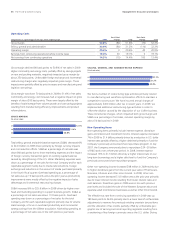
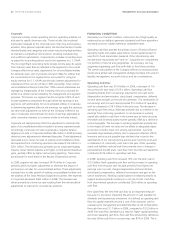
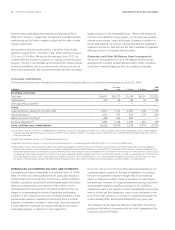
Total selling, general and administrative expenses (SG&A) decreased 6%
to $24.0billion in 2009 driven primarily by foreign currency impacts
and cost reduction efforts. SG&A as a percentage of net sales was
down 80 basis points due to lower marketing expenses and the impact
of foreign currency transaction gains on working capital balances
caused by strengthening of the U.S. dollar. Marketing expenses were
down as a percentage of net sales for the total Company and for each
reportable segment mainly due to media rate reductions, foreign
exchange and reductions in the amount of media purchased primarily
in the fourth fiscal quarter. Overhead spending as a percentage of
net sales was up 10 basis points versus the prior year as productivity
improvements were mostly offset by the negative impacts of sales
deleverage and incremental restructuring charges.
SG&A increased 6% to $25.6billion in 2008 driven by higher over-
head and marketing spending to support business growth. SG&A as
a percentage of net sales was down 110 basis points. Overhead
spending was down as a percentage of net sales for the total
Company and for each reportable segment primarily due to volume
scale leverage, a focus on overhead productivity and incremental
synergy savings from the Gillette acquisition. Marketing spending as
a percentage of net sales was in line with previous year levels.
32.3%
30.%
31.2%
07
09
08
SELLING, GENERAL AND ADMINISTRATIVE EXPENSE
(% of net sales)
We fund a number of restructuring-type activities primarily related
to manufacturing and workforce optimization efforts to maintain a
competitive cost structure. We have incurred annual charges of
approximately $400million after tax in recent years. In 2009, we
implemented additional restructuring-type activities in order to
offset the dilution caused by the disposition of our Coffee business.
These incremental charges, which impacted both gross margin and
SG&A as a percentage of net sales, reduced operating margin by
about 50 basis points in 2009.
Non-Operating Items
Non-operating items primarily include interest expense, divestiture
gains and interest and investment income. Interest expense decreased
7% in 2009 to $1.4billion primarily driven by a reduction in U.S. dollar
interest rates partially offset by a higher debt level primarily to fund the
Company’s previously announced share repurchase program. In July
2007, the Company announced plans to repurchase $24–30billion
of P&G stock over a three-year period. In 2008, interest expense
increased 13% to $1.5billion driven by a higher interest rate on our
long-term borrowings and a higher debt level to fund the Company’s
previously announced share repurchase program.
Other non-operating income increased $98million in 2009 mainly due
to higher divestiture gains from the current year sales of Thermacare,
Noxzema, Infusium and other minor brands. In 2008, other non-
operating income decreased $103million versus the prior year primarily
due to lower interest income resulting from lower interest rates and
cash balances. Divestiture gains in 2008 were in line with previous
year levels and included the sale of the Western European tissue and
Japanese adult incontinence businesses as well as other minor brands.
The effective tax rate from continuing operations in 2009 was up
180 basis points to 26.3% primarily due to a lower level of net favorable
adjustments to reserves for previously existing uncertain tax positions
and the utilization of tax credits, partially offset by unfavorable geo-
graphic mix of earnings across all reporting segments resulting from
a weakening of key foreign currencies versus the U.S. dollar. During
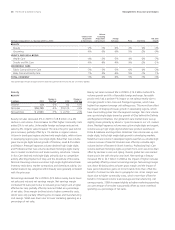
Operating Costs
Comparisons as a percentage of net sales; Years ended June 30 2009
Basis Point
Change 2008
Basis Point
Change 2007
Gross margin 50.8% (80)51.6% (70)52.3%
Selling, general and administrative 30.4% (80)31.2% (110)32.3%
Operating margin 20.4% 020.4% 40 20.0%
Earnings from continuing operations before income taxes 19.4% 30 19.1% 019.1%
Net earnings from continuing operations 14.3% (10)14.4% 100 13.4%