Pfizer 2010 Annual Report Download - page 98
Download and view the complete annual report
Please find page 98 of the 2010 Pfizer annual report below. You can navigate through the pages in the report by either clicking on the pages listed below, or by using the keyword search tool below to find specific information within the annual report.-
 1
1 -
2
-
3
-
4
-
5
-
6
-
7
-
8
-
9
-
10
-
11
-
12
-
13
-
14
-
15
-
16
-
17
-
18
-
19
-
20
-
21
-
22
-
23
-
24
-
25
-
26
-
27
-
28
-
29
-
30
-
31
-
32
-
33
-
34
-
35
-
36
-
37
-
38
-
39
-
40
-
41
-
42
-
43
-
44
-
45
-
46
-
47
-
48
-
49
-
50
-
51
-
52
-
53
-
54
-
55
-
56
-
57
-
58
-
59
-
60
-
61
-
62
-
63
-
64
-
65
-
66
-
67
-
68
-
69
-
70
-
71
-
72
-
73
-
74
-
75
-
76
-
77
-
78
-
79
-
80
-
81
-
82
-
83
-
84
-
85
-
86
-
87
-
 88
88 -
 89
89 -
 90
90 -
 91
91 -
 92
92 -
 93
93 -
 94
94 -
 95
95 -
 96
96 -
 97
97 -
 98
98 -
 99
99 -
 100
100 -
 101
101 -
 102
102 -
 103
103 -
 104
104 -
 105
105 -
 106
106 -
 107
107 -
 108
108 -
109
-
110
-
111
-
112
-
113
-
114
-
115
-
116
-
117
-
118
-
119
-
120
 |
 |

Notes to Consolidated Financial Statements
Pfizer Inc. and Subsidiary Companies
D. Performance Share Awards (PSAs) and Performance-Contingent Share Awards (PCSAs)
Senior and other key members of management may receive PSA grants and were eligible to receive PCSA grants. PSAs are
accounted for using a fair-value-based method at the date of grant in the consolidated statements of income beginning with grants in
2006. Further, PSAs generally are amortized on an even basis over the vesting term into Cost of sales, Selling, informational and
administrative expenses and Research and development expenses, as appropriate. PCSAs, which have not been awarded since
2005, were accounted for using the intrinsic value method in the consolidated statements of income. In most instances, PSA grants
vest after three years, and PCSA grants vested after five years, of continuous service from the grant date. In certain instances,
PCSA grants vested over two to four years of continuous service from the grant date. The vesting terms are equal to the contractual
terms.
PSAs entitle the holder, and PCSAs entitled the holder, upon vesting, to receive a number of shares of Pfizer common stock, within
a range of shares from zero to 200% of the holder’s target award, calculated using a formula that measures Pfizer’s performance
relative to an industry peer group over a specified performance period. PSA grants vest and are paid based on a formula that
measures our performance using total shareholder return over a specified performance period relative to an industry peer group.
PSCA grants, which were made prior to 2006 and which have all been settled, vested and were paid based on a formula that
measured our performance using total shareholder return and the change in diluted EPS over a specified performance period
relative to an industry peer group. The Compensation Committee of the Company’s Board of Directors had, with respect to PCSAs,
and has, with respect to PSAs, discretion to authorize the payment of fewer shares to a holder than the number of shares
determined pursuant to the applicable formula.
We measure PSA grants using a fair-value-based amount, which is derived from a Monte Carlo simulation model, times the target
number of shares. The target number of shares is determined by reference to the fair value of share-based awards to similar
employees in the industry peer group. We measured PCSA grants at intrinsic value whereby the probable award was allocated over
the term of the award, and then the resulting shares were adjusted to the fair value of our common stock at each accounting period
until the date of payment.
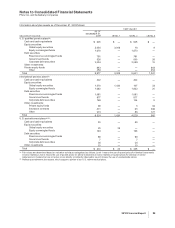
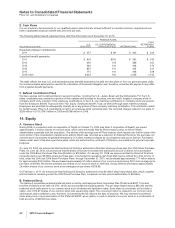
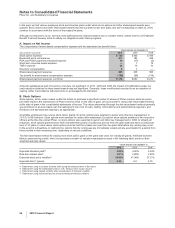
The weighted-average assumptions used in the valuation of PSAs are as follows:
YEAR ENDED DECEMBER 31,
2010 2009 2008
Risk-free interest rate 1.24% 1.95% 2.05%
Expected Pfizer stock price volatility 26.75% 40.40% 27.21%
Average peer stock price volatility 23.64% 36.30% 32.13%
Contractual term in years 333
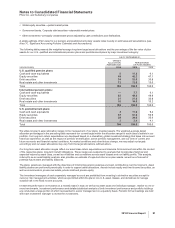
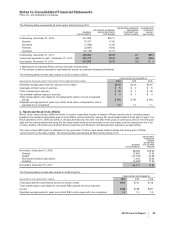
The following table summarizes all PSA and PCSA activity during 2010, with the shares granted representing the maximum award
that could be achieved:
SHARES
(THOUSANDS)
WEIGHTED-
AVERAGE
GRANT
DATE FAIR
VALUE PER
SHARE
Nonvested, December 31, 2009 6,118 $23.07
Granted 2,531 19.17
Vested (163) 17.69
Forfeited (4,023) 20.75
Modifications(a) 706 14.18
Nonvested, December 31, 2010 5,169 21.92
(a) Modifications include pro-ration of the awards for service to the date of termination for 15 former employees in 2010. The modifications were made
at the discretion of the Senior Vice President of Worldwide Human Resources, or her designee for 2010. There was no incremental cost related to
the modifications.
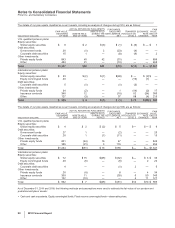
The following table provides data related to all PSA and PCSA activity:
YEAR ENDED DECEMBER 31,
(MILLIONS OF DOLLARS, EXCEPT YEARS) 2010 2009 2008
Total intrinsic value of vested PSA/PCSA shares $3 $37 $15
Total compensation cost related to nonvested PSA grants not yet recognized, pre-tax $18 $17 $20
Weighted-average period in years over which PSA cost is expected to be recognized 222
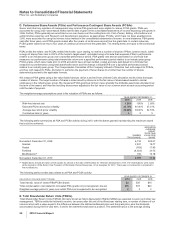
E. Total Shareholder Return Units (TSRUs)
Total Shareholder Return Units (TSRUs) (formerly known as Stock Appreciation Rights (SARs)) are awarded to senior and other key
management. TSRUs entitle the holders to receive, two years after the end of the three-year vesting term, a number of shares of our
common stock with a value equal to the difference between the defined settlement price and the grant price, plus the dividends
accumulated during the five-year term, if and to the extent the total value is positive. The settlement price is the average closing
96 2010 Financial Report