Pfizer 2010 Annual Report Download - page 92
Download and view the complete annual report
Please find page 92 of the 2010 Pfizer annual report below. You can navigate through the pages in the report by either clicking on the pages listed below, or by using the keyword search tool below to find specific information within the annual report.-
 1
1 -
2
-
3
-
4
-
5
-
6
-
7
-
8
-
9
-
10
-
11
-
12
-
13
-
14
-
15
-
16
-
17
-
18
-
19
-
20
-
21
-
22
-
23
-
24
-
25
-
26
-
27
-
28
-
29
-
30
-
31
-
32
-
33
-
34
-
35
-
36
-
37
-
38
-
39
-
40
-
41
-
42
-
43
-
44
-
45
-
46
-
47
-
48
-
49
-
50
-
51
-
52
-
53
-
54
-
55
-
56
-
57
-
58
-
59
-
60
-
61
-
62
-
63
-
64
-
65
-
66
-
67
-
68
-
69
-
70
-
71
-
72
-
73
-
74
-
75
-
76
-
77
-
78
-
79
-
80
-
81
-
 82
82 -
 83
83 -
 84
84 -
 85
85 -
 86
86 -
 87
87 -
 88
88 -
 89
89 -
 90
90 -
 91
91 -
 92
92 -
 93
93 -
 94
94 -
 95
95 -
 96
96 -
 97
97 -
 98
98 -
 99
99 -
 100
100 -
 101
101 -
 102
102 -
103
-
104
-
105
-
106
-
107
-
108
-
109
-
110
-
111
-
112
-
113
-
114
-
115
-
116
-
117
-
118
-
119
-
120
 |
 |

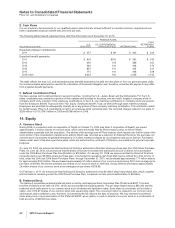
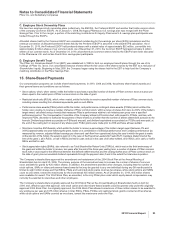
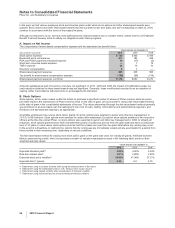
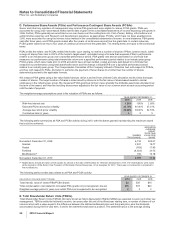
Notes to Consolidated Financial Statements
Pfizer Inc. and Subsidiary Companies
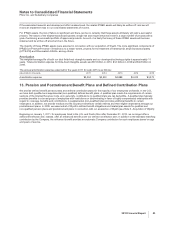
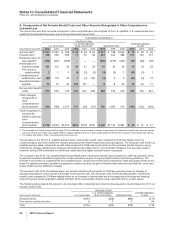
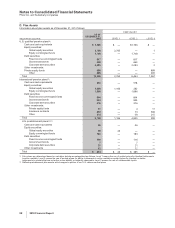
The details of our plan assets classified as Level 3 assets, including an analysis of changes during 2010, are as follows:
(MILLIONS OF DOLLARS)
FAIR VALUE,
BEGINNING
OF YEAR
ACTUAL RETURN ON PLAN ASSETS PURCHASES,
SALES AND
SETTLEMENTS,
NET
TRANSFER
INTO/(OUT OF)
LEVEL 3
EXCHANGE
RATE
CHANGES
FAIR
VALUE,
END OF
YEAR
ASSETS HELD,
END OF YEAR
ASSETS SOLD
DURING THE
PERIOD
U.S. qualified pension plans:
Equity securities:
Global equity securities $ 9 $ 2 $ (3) $ (1) $ (6) $ — $ 1
Debt securities:
Government bonds 26 (1) 2 (23) (4) — —
Corporate debt securities 15 1 — (8) (6) — 2
Other investments:
Private equity funds 843 45 42 (31) — — 899
Other 454 21 — (10) — — 465
Total $1,347 $68 $41 $(73) $(16) $ — $1,367
International pension plans:
Equity securities:
Global equity securities $ 33 $ (2) $ (1) $(28) $ — $ (2) $ —
Equity commingled funds 20 — — — (19) (1) —
Debt securities:
Corporate debt securities 5 (1) — (1) (3) — —
Other investments:
Private equity funds 34 (2) — 1 (14) (2) 17
Insurance contracts 346 12 — (10) 52 (34) 366
Other 127 (3) — 37 58 (4) 215
Total $ 565 $ 4 $ (1) $ (1) $ 74 $(43) $ 598
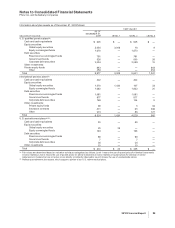
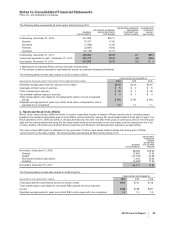
The details of our plan assets classified as Level 3 assets, including an analysis of changes during 2009, are as follows:
(MILLIONS OF DOLLARS)
FAIR VALUE,
BEGINNING
OF YEAR
ACTUAL RETURN ON PLAN ASSETS PURCHASES,
SALES AND
SETTLEMENTS,
NET
TRANSFER
INTO/(OUT OF)
LEVEL 3
EXCHANGE
RATE
CHANGES
FAIR
VALUE,
END OF
YEAR
ASSETS HELD,
END OF YEAR
ASSETS SOLD
DURING THE
PERIOD
U.S. qualified pension plans:
Equity securities:
Global equity securities $ 4 $ 2 $ (2) $ 5 $— $ — $ 9
Debt securities:
Government bonds 27 1 — (2) — — 26
Corporate debt securities 26 1 (1) (11) — — 15
Other investments:
Private equity funds 821 (44) 19 47 — — 843
Other 356 (21) 3 116 — — 454
Total $1,234 $(61) $ 19 $155 $— $— $1,347
International pension plans:
Equity securities:
Global equity securities $ 72 $ 15 $(25) $ (32) $— $ 3 $ 33
Equity commingled funds 29 (5) — (6) — 2 20
Debt securities:
Corporate debt securities 4 — — (1) 2 — 5
Other investments:
Private equity funds 26 (4) — 8 — 4 34
Insurance contracts 309 11 — (30) 6 50 346
Other 122 (10) — — 4 11 127
Total $ 562 $ 7 $(25) $ (61) $12 $70 $ 565
As of December 31, 2010 and 2009, the following methods and assumptions were used to estimate the fair value of our pension and
postretirement plans’ assets:
•Cash and cash equivalents, Equity commingled funds, Fixed-income commingled funds—observable prices.
90 2010 Financial Report