Pfizer 2010 Annual Report Download - page 97
Download and view the complete annual report
Please find page 97 of the 2010 Pfizer annual report below. You can navigate through the pages in the report by either clicking on the pages listed below, or by using the keyword search tool below to find specific information within the annual report.-
 1
1 -
2
-
3
-
4
-
5
-
6
-
7
-
8
-
9
-
10
-
11
-
12
-
13
-
14
-
15
-
16
-
17
-
18
-
19
-
20
-
21
-
22
-
23
-
24
-
25
-
26
-
27
-
28
-
29
-
30
-
31
-
32
-
33
-
34
-
35
-
36
-
37
-
38
-
39
-
40
-
41
-
42
-
43
-
44
-
45
-
46
-
47
-
48
-
49
-
50
-
51
-
52
-
53
-
54
-
55
-
56
-
57
-
58
-
59
-
60
-
61
-
62
-
63
-
64
-
65
-
66
-
67
-
68
-
69
-
70
-
71
-
72
-
73
-
74
-
75
-
76
-
77
-
78
-
79
-
80
-
81
-
82
-
83
-
84
-
85
-
86
-
 87
87 -
 88
88 -
 89
89 -
 90
90 -
 91
91 -
 92
92 -
 93
93 -
 94
94 -
 95
95 -
 96
96 -
 97
97 -
 98
98 -
 99
99 -
 100
100 -
 101
101 -
 102
102 -
 103
103 -
 104
104 -
 105
105 -
 106
106 -
 107
107 -
108
-
109
-
110
-
111
-
112
-
113
-
114
-
115
-
116
-
117
-
118
-
119
-
120
 |
 |

Notes to Consolidated Financial Statements
Pfizer Inc. and Subsidiary Companies
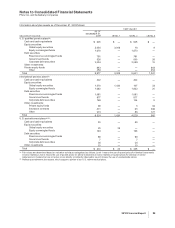
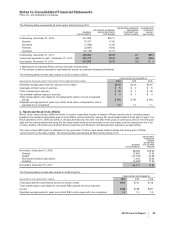
The following table summarizes all stock option activity during 2010:
SHARES
(THOUSANDS)
WEIGHTED-AVERAGE
EXERCISE PRICE
PER SHARE
WEIGHTED-AVERAGE
REMAINING
CONTRACTUAL
TERM (YEARS)
AGGREGATE
INTRINSIC
VALUE(a)
(MILLIONS)
Outstanding, December 31, 2009 447,693 $30.11
Granted 70,327 17.62
Exercised (1,280) 12.80
Forfeited (5,997) 18.56
Canceled (52,139) 31.07
Outstanding, December 31, 2010 458,604 28.29 4.7 $215
Vested and expected to vest(b), December 31, 2010 451,279 28.46 4.6 $205
Exercisable, December 31, 2010 311,919 33.36 2.9 $ 3
(a) Market price of underlying Pfizer common stock less exercise price.
(b) The number of options expected to vest takes into account an estimate of expected forfeitures.
The following table provides data related to all stock option activity:
YEAR ENDED DECEMBER 31,
(MILLIONS OF DOLLARS, EXCEPT PER STOCK OPTION AMOUNTS AND YEARS) 2010 2009 2008
Weighted-average grant date fair value per stock option $3.25 $3.30 $3.30
Aggregate intrinsic value on exercise $5 $2 $9
Cash received upon exercise $16 $7 $29
Tax benefits realized related to exercise $1 $1 $3
Total compensation cost related to nonvested stock options not yet recognized,
pre-tax $ 178 $ 147 $ 159
Weighted-average period in years over which stock option compensation cost is
expected to be recognized 1.3 1.2 1.1
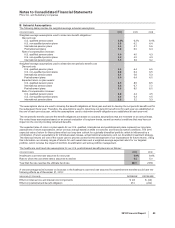
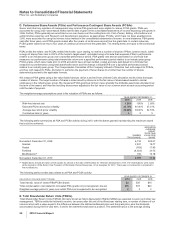
C. Restricted Stock Units (RSUs)
RSUs, which, when vested, entitle the holder to receive a specified number of shares of Pfizer common stock, including shares
resulting from dividend equivalents paid on such RSUs, are accounted for using a fair-value-based method at the date of grant. For
RSUs granted in 2010, 2009 and 2008, in virtually all instances, the units vest after three years of continuous service from the grant
date and the values determined using the fair-value-based method are amortized on an even basis over the vesting term into Cost
of sales, Selling, informational and administrative expenses and Research and development expenses, as appropriate.
The value of each RSU grant is estimated on the grant date. The fair-value-based method utilizes the closing price of Pfizer
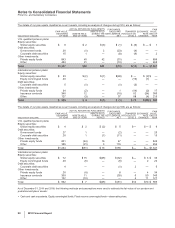
common stock on the date of grant. The following table summarizes all RSU activity during 2010:
SHARES
(THOUSANDS)
WEIGHTED-
AVERAGE
GRANT
DATE FAIR
VALUE PER
SHARE
Nonvested, December 31, 2009 38,083 $19.90
Granted 17,493 17.55
Vested (12,705) 24.48
Reinvested dividend equivalents 1,764 16.90
Forfeited (3,458) 17.36
Nonvested, December 31, 2010 41,177 17.57
The following table provides data related to all RSU activity:
YEAR ENDED DECEMBER 31,
(MILLIONS OF DOLLARS EXCEPT YEARS) 2010 2009 2008
Total grant date fair-value-based amount of shares vested $311 $131 $119
Total compensation cost related to nonvested RSU awards not yet recognized,
pre-tax $230 $198 $257
Weighted-average period in years over which RSU cost is expected to be recognized 1.4 1.3 1.5
2010 Financial Report 95